




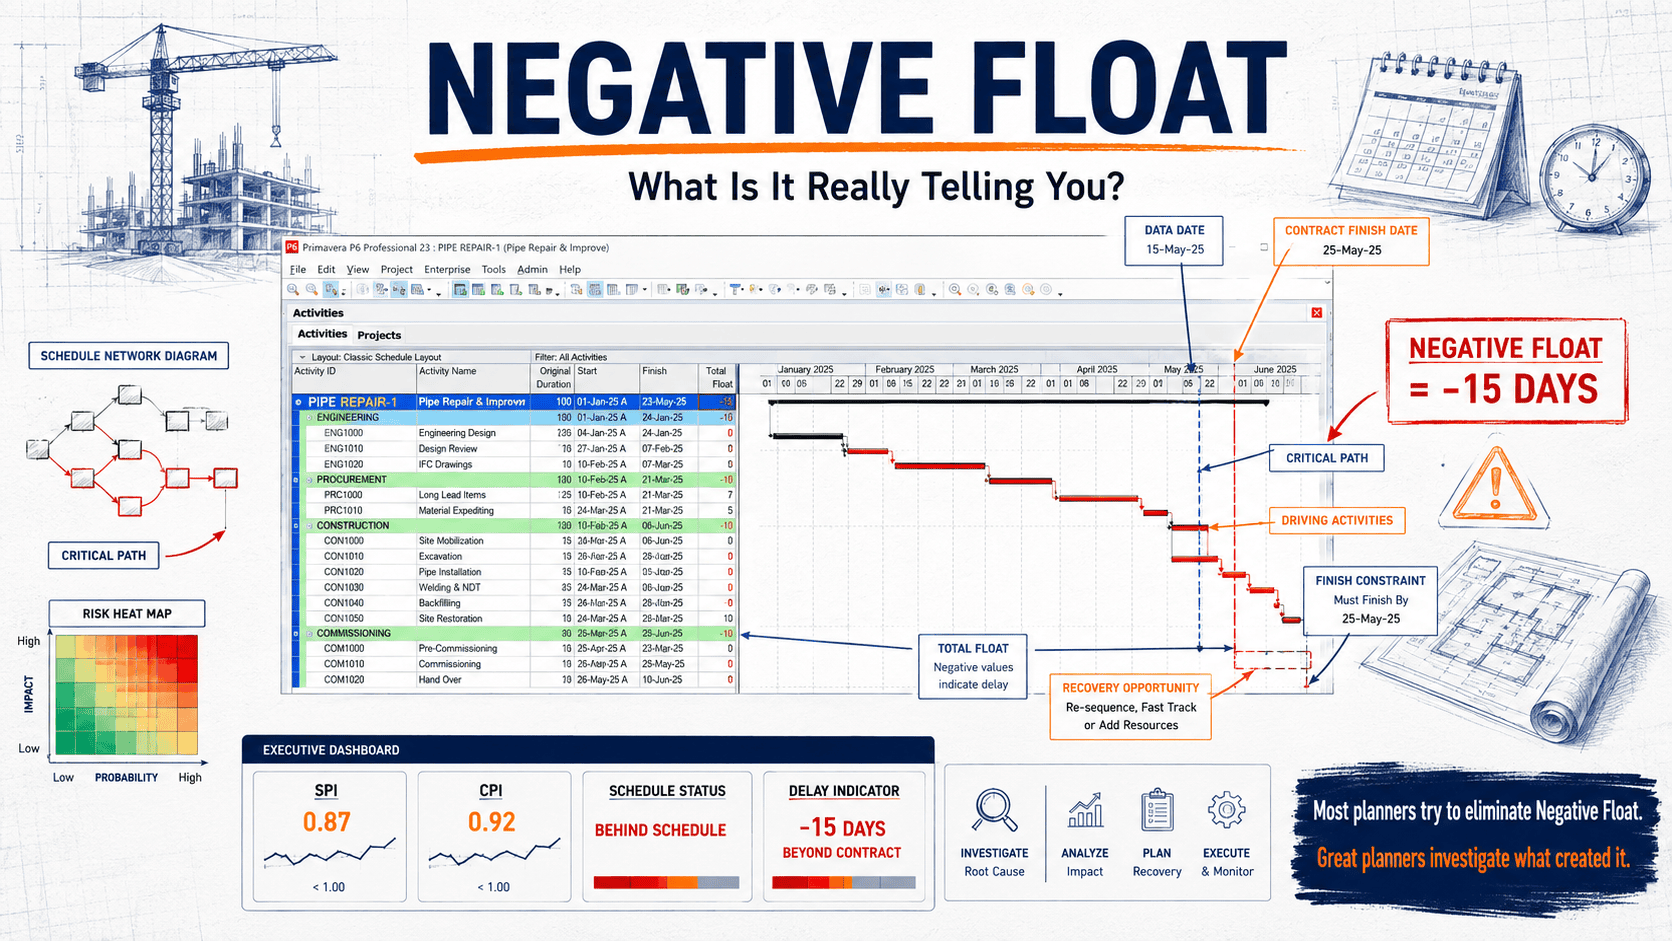
A step-by-step diagnostic method, symptom cheat sheet, and recovery menu for clearing negative float – built from field practice in project control, not the manual.
Every planner eventually gets the phone call: “Why is the schedule showing minus fourteen days?” What separates a seasoned scheduler from a nervous one is not knowing the answer instantly – it is having a repeatable method to find it in twenty minutes instead of two days. This playbook is that method: the exact filters, checks, decision tables, and recovery moves I use whenever negative float appears in a Primavera P6 schedule, refined across highway, rail, water, and vertical construction projects.
Treat it as a reference. Keep it beside you during updates. Nothing here requires add-ons or macros – just P6 Professional and a disciplined sequence of checks.
The Mechanics in Sixty Seconds
P6 calculates dates in two passes. The forward pass walks the network from the data date, producing Early Start and Early Finish – the soonest each activity can happen. The backward pass walks from the project finish (or from constrained dates) back to the data date, producing Late Start and Late Finish – the latest each activity may happen without breaching a rule. Total Float is the gap between them:
| Field | Produced By | Meaning |
| Early Start / Early Finish | Forward pass | The soonest the activity CAN occur, given logic and progress |
| Late Start / Late Finish | Backward pass | The latest the activity MAY occur, given constraints and the finish date |
| Total Float = LF – EF | Both passes | Positive: buffer exists. Zero: critical. Negative: a rule cannot be met |
So Negative Float in Primavera P6 has exactly one mathematical meaning: somewhere, the backward pass is being pulled earlier than the forward pass can deliver. Only a handful of things can pull the backward pass: date constraints, the project Must Finish By date, deadline-type settings, and – indirectly – anything that pushes the forward pass out, like stale logic, bad actuals, calendar mismatches, or long lags on the driving path. The whole diagnostic game is working out which.
The Five-Step Diagnosis Loop
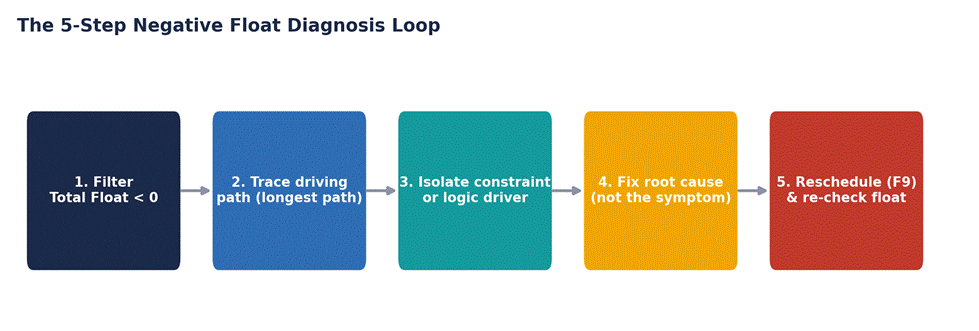
Figure 1 – The diagnosis loop. Run it repeatedly; complex schedules usually carry two or three stacked causes.
Step 1 – Filter and rank
Build a filter: Total Float < 0. Group by Total Float, sort ascending, and note the deepest value. If a long chain of activities shares one identical negative value, suspect a single downstream constraint or the project finish date. If negative values are scattered and shallow, suspect calendars or local activity constraints.
Step 2 – Trace the driving path
Select the worst activity and open Trace Logic (or turn on the Longest Path filter). Walk successors downstream until the float changes or you hit a constrained activity. The point where the negative value originates is your crime scene.
Step 3 – Isolate the driver
At the crime scene, check in this order: the activity’s Primary Constraint field, the Project Must Finish By date, actual dates relative to the data date, relationship lags on the incoming/outgoing links, and finally the calendars assigned to the activity and its resources. The order matters – it runs from most-likely to least-likely, and the early checks take seconds.
Step 4 – Fix the root cause
Use the decision matrix in the next section. The discipline is to change the thing that caused the problem, not the thing that displays it. Cutting a duration because the float is red is display management, not planning.
Step 5 – Reschedule and repeat
Press F9, re-run the filter, and go again. Peeling one cause frequently reveals another beneath it. You are finished when the only negative float remaining is an honest forecast overrun against a date that genuinely binds the project.
The Diagnostic Cheat Sheet
This is the table I keep pinned above my desk. Match the symptom pattern on the left to jump straight to the likely driver.
| Symptom Pattern in the Float Column | Most Likely Driver | Where to Look in P6 | The Fix | ||
| One long chain, identical negative value on every activity | Project Must Finish By date, or one constraint at the end of the chain | Project Details → Dates tab; last activity’s constraint field | Verify MFB matches the current contractual date incl. approved EOTs; remove or justify the constraint | ||
| Deep negative on one activity, predecessors healthy | Hard constraint on that activity (Mandatory / Finish On or Before) | Activity Details → Status tab → Constraints | Delete it, or downgrade to a justified ‘On or Before’ with a source document | ||
| Negative float appeared right after a progress update | Out-of-sequence progress under Retained Logic, or actuals beyond the data date | Schedule Log (out-of-sequence list); filter for Actual dates > data date | Repair logic to as-built sequence; correct impossible actuals from site records | ||
| Shallow, scattered negatives (-1d/-2d) with no clear path | Calendar conflicts between activity, resource, or lag calendars | Activity calendars vs. resource calendars; schedule options → lag calendar | Harmonise calendars; standardise the lag calendar setting | ||
| Trace stops at a relationship, not an activity | Long lag consuming the backward pass invisibly | Relationships tab → lag values on the driving path | Convert the lag into a real, statusable activity (curing, approvals, procurement) | ||
| 🔍 Reading the constraint landscape Before the trace, run one report: group all activities by Primary Constraint. In hundreds of audits, the distribution below is what typically drives the negative float I find – dominated by finish-side constraints, most of which no longer have a living justification. | |||||
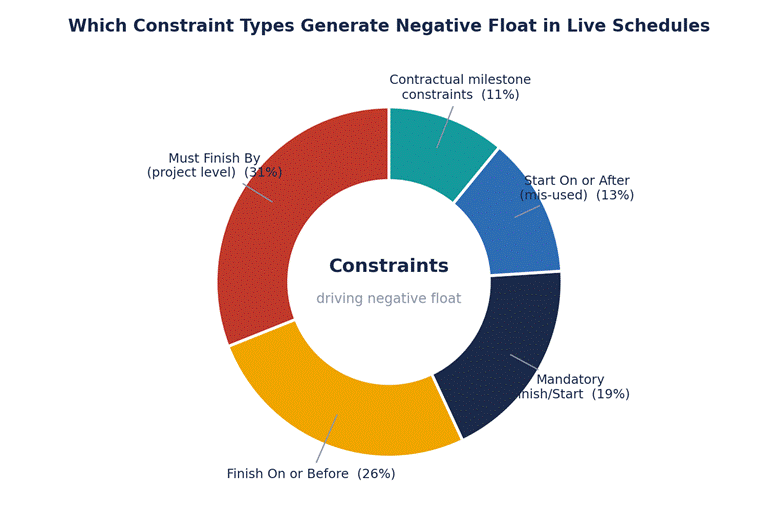
Figure 2 – Constraint types found driving negative float across audited schedules. Finish-side constraints account for roughly three-quarters of cases.
When the Negative Float Is Real: The Recovery Menu
Suppose the diagnosis loop is done, the model is clean, and 14 days of negative float remain against a fixed contractual completion. Now it is a recovery problem, and there are only four levers. Model each in a copy of the project – never the live schedule – before recommending anything.
| Recovery Lever | How It Works in P6 | Typical Yield | Cost / Risk Profile | Watch Out For |
| Crash (add resources / shifts) | Reduce remaining durations with agreed crew or shift changes | Low–moderate on sequence-bound work | High direct cost; diminishing returns; fatigue and quality risk | Duration cuts must be backed by a resourcing decision, not hope |
| Fast-track (overlap) | Convert FS links to SS + lag or FF pairs between trades | Often the biggest yield | Rework risk if predecessor output changes; supervision load | Site must validate every overlap; keep FF ties so successors can’t finish first |
| Re-sequence / zone | Split large activities into zones; leapfrog trades | High on repetitive work (floors, spans, chainages) | Disruption, temporary works, access planning | Zone boundaries need trade agreement and physical logic |
| Calendar changes | Add Saturdays or extend hours on the driving path only | Predictable, modest | Premium labour rates; consent/noise limits; burnout | Change calendars on driving-path activities, not globally |
Here is what the menu looks like when the options are modelled against the same deadline. Presenting scenarios this way – same axis, same deadline line – is the fastest route to a management decision I have found:
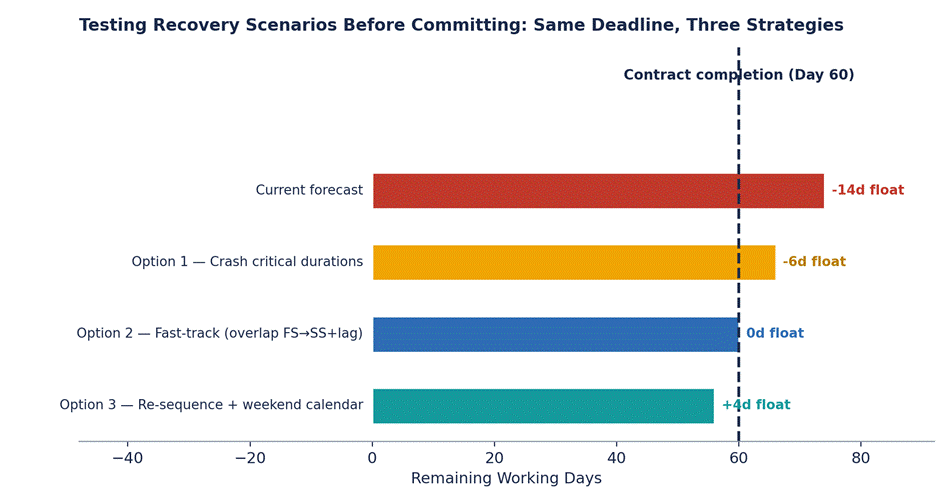
Figure 3 – Three modelled recovery scenarios against the same contractual completion. Only the re-sequence restores positive float; the comparison makes the recommendation self-evident.
| 💡 Expert tip Attach a cost and a risk sentence to every scenario bar. ‘Option 3 restores +4 days for approximately $38k of additional supervision and temporary access, with medium disruption risk on Level 2.’ Recovery decisions stall when options carry days but no dollars. |
Prevention: The Update-Day Checklist
Most negative float is manufactured slowly, one lazy update at a time. This checklist, run before publishing every update, keeps the schedule clean enough that any negative float which does appear is real and actionable:
- Confirm the data date is correct and no actual date sits beyond it.
- Work the Schedule Log’s out-of-sequence list to zero – repair logic or document the exception.
- Review every constraint against its written justification; delete orphans.
- Confirm the project Must Finish By date equals the current contractual completion, including approved extensions.
- Scan the driving path for lags over 5 days; convert persistent ones to activities.
- Reschedule, filter Total Float < 0, and explain every remaining negative value in the update narrative – cause, owner, and recovery action.
Common Mistakes
- ❌ Diagnosing from the Gantt instead of the float column. Bars show dates; float shows rule violations. Start with the numbers.
- ❌ Fixing the worst activity instead of the driving cause. The deepest negative float is a victim, not usually the perpetrator. Trace first.
- ❌ Using constraints to ‘store’ negotiation positions. Target dates belong in baselines and reports, not in the calculation engine.
- ❌ Publishing recovery scenarios from the live project file. One accidental save and your what-if is the plan of record.
- ❌ Treating zero float as healthy. A path at 0d with a 6-week update cycle is a path that will be negative before you next look at it.
Key Takeaways
- 📌 Negative float has one mathematical cause – the backward pass beating the forward pass – and a short list of practical drivers: constraints, the finish date, stale logic, bad actuals, calendars, and lags.
- 📌 Diagnose in a loop: filter, trace, isolate, fix the root, reschedule. Stacked causes are the norm, not the exception.
- 📌 Symptom patterns are diagnostic: uniform chains point to end constraints; scattered shallow negatives point to calendars; post-update appearances point to progress and logic.
- 📌 Real negative float gets a recovery menu – crash, fast-track, re-sequence, calendars – modelled in copies, priced, and presented side by side.
- 📌 Prevention is a six-line checklist on update day. Clean schedules make negative float rare, and meaningful when it happens.
Frequently Asked Questions
What is the fastest way to find what’s driving negative float?
Filter Total Float < 0, sort ascending, open Trace Logic on the worst activity, and walk downstream to the first constrained activity or the project finish. In clean schedules this takes under ten minutes. If the trace is confusing, check the Schedule Log first – out-of-sequence progress muddies traces badly.
Can negative float exist without any constraints in the schedule?
Only via the project-level Must Finish By date (which behaves as a constraint on the whole network), impossible actual dates, or certain leveling and calendar interactions. A schedule with no MFB date, no constraints, and clean actuals cannot show negative float – which is also why such a schedule tells you nothing about deadline risk.
Should the baseline ever contain negative float?
Never. A baseline is a commitment, and committing to a plan that violates its own rules is a contradiction. Resolve every negative value – through logic, sequence, or a formally revised date – before baselining. Negative float belongs to forecasts, not commitments.
How do multiple calendars cause negative float exactly?
The forward pass may schedule work under one calendar while the backward pass, lags, or resource assignments compute under another. A 6-day resource calendar meeting a 5-day activity calendar can produce late dates a day or two earlier than early dates – the classic scattered -1d/-2d pattern. Standardise calendars on the driving path and set the lag calendar option deliberately.
Is negative float the same as being behind schedule?
Not necessarily. You can be behind an internal target with healthy float if no constraint binds, and you can show negative float while physically on time if the model contains a stale constraint. Negative float measures rule violation in the network; delay measures performance against a commitment. Confusing the two is how schedules lose audiences.
Do lags with negative values (‘leads’) help fix negative float?
They can compress a path, but use them sparingly and only where the overlap is physically real – a -5d lag on a Finish-to-Start is just a disguised Start-to-Start that reviewers may miss. Where an overlap is a genuine execution decision, model it explicitly as SS plus a positive lag, note it in the narrative, and get the site team’s signature on it. Hidden leads are one of the first things a forensic analyst hunts for, and they rarely survive scrutiny.
How should negative float be shown in reports to senior management?
Three lines per affected path: the number (with trend), the cause in one plain-English sentence, and the recovery action with an owner and a date. Executives do not need the mechanics of the backward pass; they need to know whether the handover date stands and what it costs to hold it.