


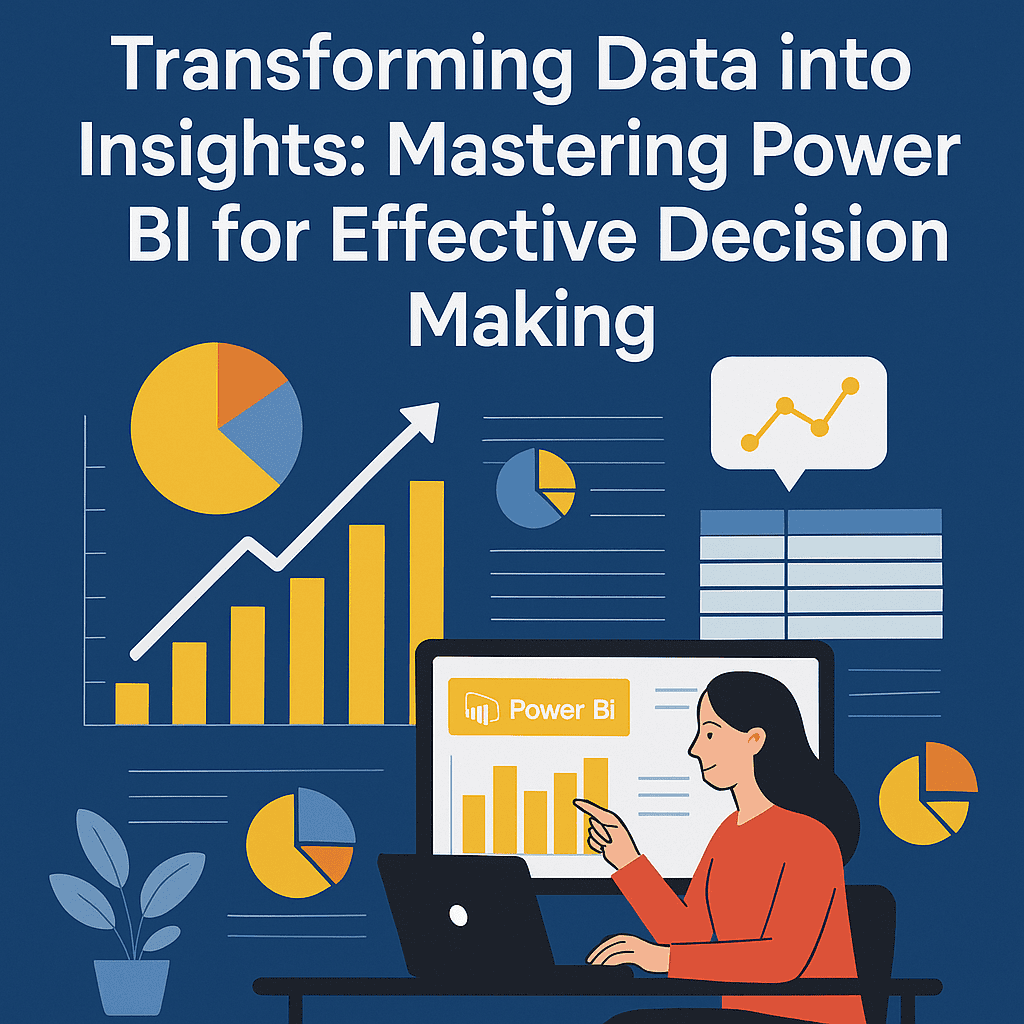
Transforming Data into Insights: Mastering Power BI for Effective Decision Making
In today’s data-driven world, making informed decisions relies on how effectively we can visualize and analyze our data. Power BI stands out as a robust tool that bridges the gap between raw data and actionable insights. Let’s delve into how Power BI can be leveraged for effective decision-making, sprinkled with some practical examples and case studies.
Imagine having a dashboard that allows you to track sales performance in real-time. With Power BI, you can connect various data sources, create dynamic visualizations, and share insights across your organization. 🎉
Understanding Power BI and Its Components
Power BI is essentially split into three components: Power BI Desktop, Power BI Service, and Power BI Mobile.
- Power BI Desktop: This is the primary authoring and publishing tool for Power BI, allowing users to create reports and dashboards from diverse data sources.
- Power BI Service: This is the cloud-based platform for sharing and collaborating on reports and dashboards.
- Power BI Mobile: An app that allows users to access reports and dashboards on their mobile devices, ensuring insights are available on the go.
Connecting to Data Sources
A key feature of Power BI is its ability to connect to various data sources, including SQL databases, Excel, CRM systems, and cloud services like Azure. For example, consider a retail company wanting to analyze sales data. Connecting Power BI to their SQL database lets them pull in data related to sales figures, customer demographics, and inventory.
Here’s a simple table that illustrates some common data sources you can connect to in Power BI:
| Data Source | Type | Notes |
|---|---|---|
| SQL Server | On-premise/Cloud | Great for large datasets. |
| Excel | File-based | Easy to use for quick analyses. |
| SharePoint | Collaboration | Useful for project management data. |
| Web APIs | Online data sources | Connect to external services easily. |
Creating Visualizations
Once you’ve connected your data, the next step is to transform it into compelling visualizations. Power BI offers a variety of visual options, such as bar charts, line graphs, pie charts, and even geospatial maps.
Example: Visualizing Sales Data 📊
Let’s say the retail company mentioned earlier wants to visualize their monthly sales data against target performance. Within Power BI, you can create a line chart that shows both actual sales figures and sales targets over a timeline.
- Data Preparation: Clean and preprocess your data using Power Query.
- Create the Visualization: Drag and drop fields to construct your line chart.
- Stylize: Use color coding to distinguish actual sales from targets.
With this chart, stakeholders can easily see how well the company performs against its goals. This visual representation can prompt discussions on strategies if there are discrepancies.
Sharing Insights with Power BI Service
After creating your reports and dashboards, the next step is sharing these insights across your organization using Power BI Service. This platform allows you to publish dashboards, collaborate by commenting directly on the visualizations, and even set alerts for specific data changes.
For example, the retail company could set alerts to notify management whenever sales drop below a specific threshold. This ensures proactive measures can be taken to address potential issues.
Case Study: Improved Decision-Making with Power BI
Consider a fictional case study of “Tech Solutions,” a mid-sized IT firm facing challenges in project management.
Challenge: The company struggled to track project statuses, budgets, and timelines, leading to missed deadlines and unhappy clients.
Solution: By implementing Power BI, they connected data from their project management tools and finance systems.
Steps Taken:
- Data Integration: Pulled data from tools like Trello and QuickBooks.
- Dashboard Creation: Developed a comprehensive dashboard displaying real-time project progress, budget usage, and resource allocation.
- Insight Sharing: Published the dashboard on Power BI Service for team members to access remotely.
Results: Within months, Tech Solutions improved project delivery time by 30%, reduced budget overruns, and achieved higher client satisfaction. Their success demonstrates how Power BI can enhance operational efficiency through data visualization.
Best Practices for Effective Decision-Making
- Define Clear Objectives: Before diving into data, clarify what insights you need to drive your decisions.
- Engage Team Members: Involve stakeholders in the visualization process to ensure the dashboards meet their needs.
- Regular Updates: Keep your data refreshed regularly to capture the most accurate insights.
Power BI Templates
To streamline your process, consider utilizing Power BI templates designed for various industries. You can find customizable templates for:
- Sales Analytics
- Financial Performance
- Customer Satisfaction
Conclusion
Power BI is an indispensable tool for anyone looking to transform data into insights for effective decision-making. By connecting to diverse data sources, creating compelling visualizations, and actively sharing insights, you can empower your organization to make data-driven decisions confidently. 🌟
FAQs
Q1: Can I integrate Power BI with Excel?
Absolutely! Power BI works seamlessly with Excel, allowing you to import Excel data directly into your reports.
Q2: Is Power BI suitable for small businesses?
Yes! Power BI’s versatile pricing plans make it accessible for businesses of all sizes.
Q3: How can I learn more about Power BI?
You can explore the official Microsoft Power BI documentation here.
Q4: Are there any limitations with Power BI?
While Power BI is powerful, it does have limitations, such as data capacity and refresh rates, specific to your subscription plan.
Q5: What types of data can I use in Power BI?
You can connect to diverse data types, including relational databases, cloud services, and flat files like CSV and Excel.
By mastering Power BI, you’re not just deploying a reporting tool; you’re implementing a powerful way to shape your business strategy and drive success! 🎯