CPI and SPI trends: read the direction, not just the number
Read period and cumulative CPI and SPI together, test the data behind changing trends, and turn earned-value signals into practical decisions.
By Dr. Hassan Khames EliwaLast updated
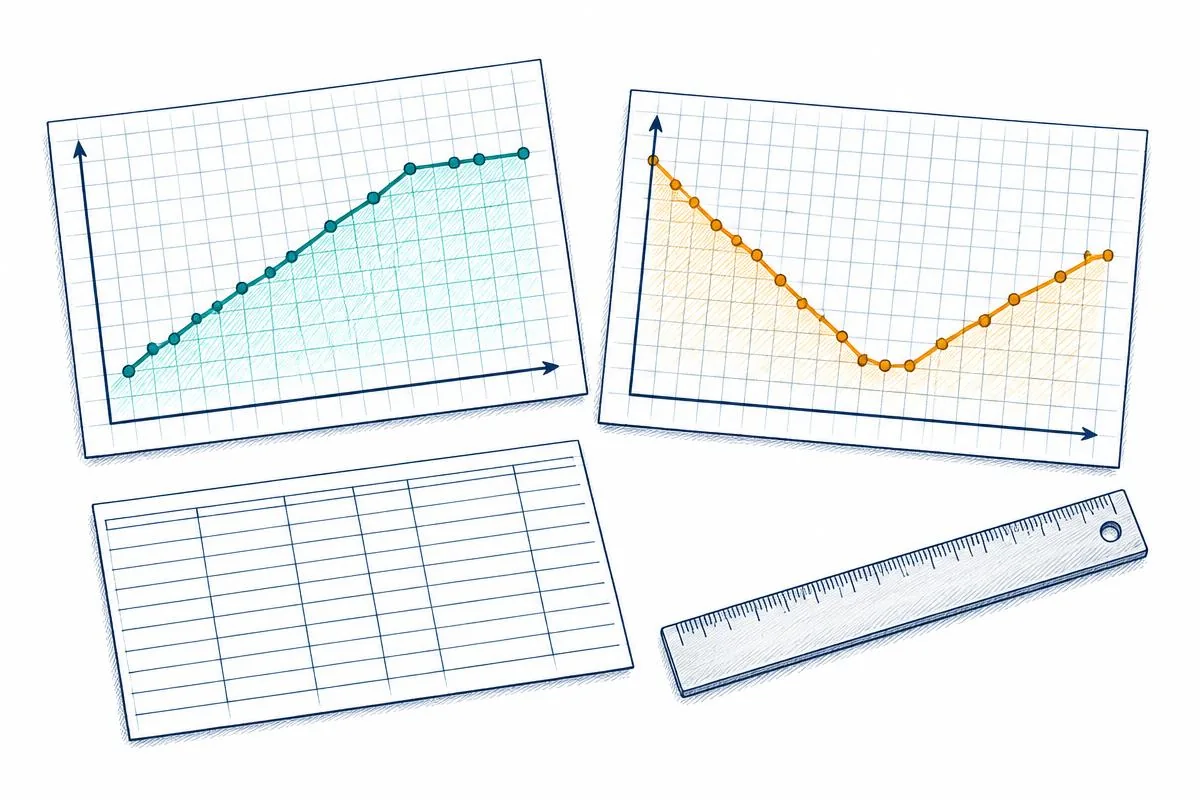
A green dashboard can conceal a deteriorating job
A cost performance index of 1.05 looks comfortable until you learn that it was 1.18 last month. Equally, a project at 0.92 may be recovering after several months of much weaker performance. Neither the current level nor the direction is sufficient alone. The useful question is what the latest work says about the work still to come.
Start a review with three views: the cumulative position, the latest reporting period and the activities driving each change. The cost performance trend calculator helps compare successive observations. It does not establish why a line moved or whether the underlying progress measurement is credible.
All monetary figures below are illustrative budget and cost units, not industry benchmarks. Keep the same currency, reporting boundary and status date throughout an analysis.
Establish what each ratio actually measures
Earned value, EV, is the budgeted value of work performed. Planned value, PV, is the budgeted value scheduled by the status date. Actual cost, AC, is the cost incurred for the work. CPI = EV / AC; SPI = EV / PV. These are the conventional earned-value relationships described in the GAO Cost Estimating and Assessment Guide. 1
CPI above one indicates more budgeted value earned than cost incurred. SPI below one indicates less budgeted value earned than planned. Neither statement establishes profit, cash availability or the number of days late. EV is a budget-based measure, not an invoice, a valuation certificate or cash received from a client.
Use the earned value calculator to check a single status-date calculation before interpreting the trend. A consistent definition matters more than a beautifully formatted graph.
Work through a deteriorating cost trend
Consider three successive periods. The first three numerical columns contain period movements, not cumulative totals. The last two columns are calculated from running totals.
| Period | Period PV | Period EV | Period AC | Period CPI | Cumulative CPI | Cumulative SPI |
|---|---|---|---|---|---|---|
| 1 | 100 | 90 | 100 | 0.9000 | 0.9000 | 0.9000 |
| 2 | 100 | 110 | 100 | 1.1000 | 1.0000 | 1.0000 |
| 3 | 150 | 120 | 150 | 0.8000 | 0.9143 | 0.9143 |
After period two, cumulative EV and AC both equal 200, so cumulative CPI is exactly one. Period three adds only 120 of earned value for 150 of cost. Cumulative CPI becomes 320 / 350 = 0.9143, while the latest period CPI is 0.8000.
The cumulative result is worse than last month, but it still dilutes the latest deterioration with earlier performance. A reviewer who sees only 0.9143 misses how weak the newest work was. A reviewer who extrapolates 0.8000 immediately may overreact to a temporary event.
Period SPI values are 0.9000, 1.1000 and 0.8000 because period PV happens to equal period AC in this example. That equality is deliberately convenient arithmetic, not a relationship to expect on an actual project.
Do not average the ratios blindly
The simple average of the three period CPIs is (0.9 + 1.1 + 0.8) / 3 = 0.9333. That is not the cumulative CPI of 0.9143. Cumulative CPI is total EV divided by total AC, equivalent to weighting each period CPI by its actual cost.
Likewise, cumulative SPI weights period SPI by planned value. A small work package and a major package should not carry equal influence merely because each occupies one spreadsheet row. Recompute ratios from their underlying totals whenever combining periods, work packages or contractors.
For a rolling window, sum EV and AC within that window before dividing. State whether the window covers three monthly periods, thirteen weeks or another interval. Comparing a four-week window with a five-week window can change the apparent pace even when productivity is stable.
Separate the signal from reporting mechanics
A late subcontractor accrual can depress one period CPI even though the physical work occurred earlier. A missing accrual can make it look unusually strong. Correct the cost cut-off before celebrating or escalating the apparent result.
Progress recognition can also create steps. A package that earns nothing until a testing milestone passes may show several weak periods followed by a sharp improvement. That pattern does not necessarily mean the installation crew suddenly became faster.
Ask whether quantities are accepted, whether rework is excluded from new earned progress and whether procurement earning rules are consistent. Large equipment deliveries can dominate aggregate EV while small critical installation activities remain behind. Drill down by control account or discipline before describing a site-wide recovery.
Read SPI with the network schedule
SPI is expressed in budget-value terms. It does not know which activity controls completion. Ahead-of-plan noncritical work can offset late critical work in the aggregate ratio. The GAO Schedule Assessment Guide treats valid logic, critical-path analysis and resource realism as necessary components of schedule assessment. 2
There is another limitation near completion. Once all baseline scope is earned, EV equals the total baseline budget. Once all baseline work was scheduled to be complete, PV also equals that budget. Conventional SPI therefore reaches one at actual completion even if completion occurred late.
Use the earned schedule calculator for a time-based companion measure where the planned-value curve supports it. Still review remaining durations, calendars and the controlling path. No single index replaces the schedule network or explains a missed contractual milestone.
Connect the trend to a conditional forecast
Suppose budget at completion is 1,000. At period three, cumulative EV is 320 and AC is 350. A simple forecast assuming future cost efficiency matches cumulative CPI gives EAC = BAC / CPI = 1,000 / (320 / 350) = 1,093.75.
If only the remaining work instead performs at the latest period CPI of 0.8, the forecast becomes AC + (BAC − EV) / 0.8 = 350 + 680 / 0.8 = 1,200. The two results differ because their future-performance assumptions differ, not because one formula is more sophisticated.
Neither is a promise. The remaining scope may differ from completed work, and a known supplier claim may require a separate allowance. Document whether recovery actions, approved changes and identifiable risks are included. Avoid adding a risk allowance twice through both an adjusted efficiency factor and a separate contingency line.
Make intervention specific enough to test
A falling CPI should produce a short causal hypothesis. For example: restricted access increased handling hours in one installation zone. The proposed action might be to release a second access route before the next shift cycle. The next review should then check handling hours, accepted output and cost coding in that zone.
“Improve productivity” is not a controllable action. Identify an owner, a completion date, an observable leading measure and the expected reporting lag. A useful action can take time to appear in cumulative CPI; do not reverse it merely because a large historical denominator keeps the line almost flat.
Close the review with an auditable narrative
Record the ratio, its movement, its principal drivers and the implication for remaining work. Distinguish baseline changes from performance changes. If an approved scope addition changes PV and BAC, show that bridge rather than describing the resulting movement as a recovery.
Retain prior snapshots so that revised historical data do not silently rewrite the trend. Where corrections are necessary, label them and explain which periods changed. The objective is not to protect a red or green status: it is to give decision-makers a stable account of what happened and what should happen next.
Calculators used in this guide
Frequently asked questions
Is a rising CPI always good?
It is generally favourable only if earned value and costs are measured consistently. Missing accruals, milestone timing or scope changes can produce misleading improvements.
Should period CPI or cumulative CPI control the forecast?
Use both as evidence. Select a future-performance assumption based on the remaining scope and the causes of recent results, rather than automatically choosing either ratio.
Can CPI values be averaged across contractors?
Not with an unweighted arithmetic mean unless actual-cost weights are equal. Divide combined earned value by combined actual cost.
Does SPI of 0.90 mean ten percent late?
No. It means earned budget value is ninety percent of planned budget value at the status date. Calendar delay requires schedule analysis.
What happens if AC or PV is zero?
The corresponding CPI or SPI is undefined. Investigate the data and show no valid ratio rather than substituting zero or an arbitrary large value.
Sources and standards
About the author
Dr. Hassan Khames Eliwa holds a PhD in Construction & Built Environment and has more than 20 years of international project controls experience. He is Director of Eliwa Project Controls Limited in Auckland and founder of PMMilestone.org and PMMilestone.com.
Buy me a coffee