Reading an S-curve: planned, earned and actual on one chart
A practical way to separate planned accomplishment, earned value and actual cost before interpreting the gaps.
By Dr. Hassan Khames EliwaLast updated
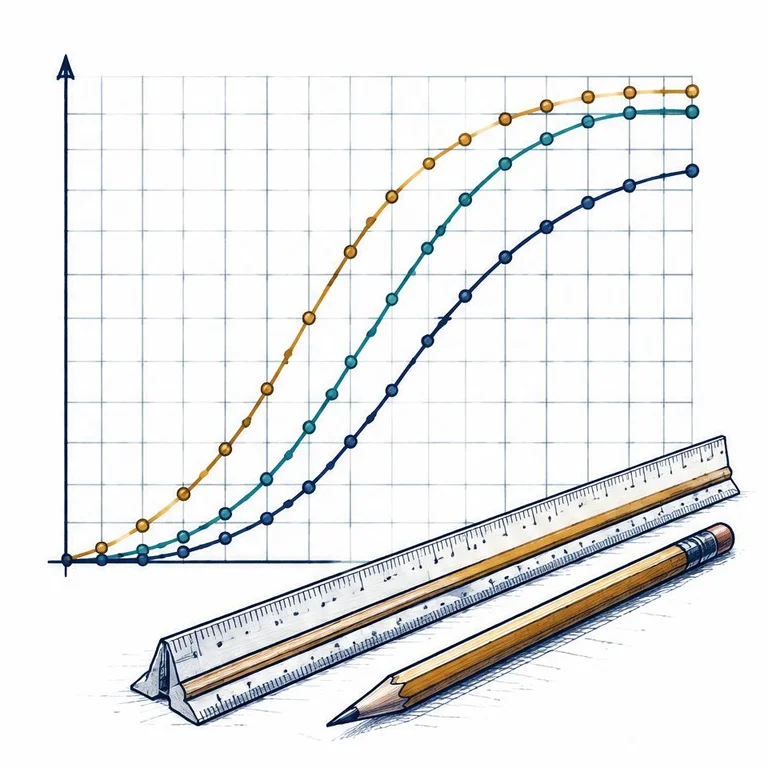
Three lines answer three different questions
An S-curve plots a cumulative measure against time. On an earned-value chart, planned value shows the budgeted work scheduled, earned value shows the budgeted value of work actually accomplished, and actual cost shows the cost incurred for that work. All three may use currency on the vertical axis, but they are not three versions of spending.
That distinction is the first check before drawing a conclusion. A high actual-cost line can mean expensive progress, advance procurement, poor productivity or a reporting mismatch. It cannot establish that more physical work has been completed. Equally, a low spending line does not prove a saving if required work has simply not happened.
Use the S-curve generator to explore a cumulative profile, while labeling whether each series is planned, observed or illustrative. A curve generated from totals and an assumed shape is not a recovered history of project performance. This generator provides planned and optional actual series, not a complete three-series earned-value history. Its actual inputs are incremental amounts, not cumulative totals. Treat them as costs when drawing a cost chart; do not relabel them as earned progress.
Establish the reporting basis before reading the shape
Put time on the horizontal axis and one consistent unit on the vertical axis. For a conventional earned-value chart, use cumulative currency values on a common scope and budget basis. Mark the status date prominently. Values to its left are reported history; lines to its right are plans or forecasts and should look different.
Confirm whether actual cost means incurred cost, paid invoices or cash disbursement. Earned-value comparisons normally need costs incurred for the work performed, including appropriate accruals. A supplier payment schedule can be useful on a cash-flow chart, but it answers a different question.
Also establish whether amounts include tax, contingency, escalation and subcontractor accruals. Comparing a tax-inclusive actual-cost series with a tax-exclusive baseline creates an apparent performance problem that no production improvement can solve.
Document the reporting period and cutoff rules. A monthly earned-value update paired with a weekly invoice extract may create artificial steps. The chart should reveal performance, not differences between data extraction dates.
Know what PV, EV and AC measure
Planned value, or PV, is the approved budget value of work scheduled to be completed by the status date. It is not necessarily the amount scheduled to be paid.
Earned value, or EV, is the approved budget value of work actually completed under the agreed measurement rules. It converts accomplishment into the same budget units used by the plan. It does not reprice completed work at its actual cost.
Actual cost, or AC, is the cost incurred for the work performed. It uses accounting evidence, supported by accruals where needed, rather than percentage-complete judgments.
Budget at completion, or BAC, is the total approved budget for the defined scope. Dividing PV and EV by the same BAC expresses planned and earned accomplishment as percentages of that budget. Dividing AC by BAC expresses expenditure relative to budget, not completion.
Read a small, explicitly illustrative reporting table
The following figures are a constructed arithmetic example, not observed project data. Assume a BAC of $100,000, consistent scope, and cumulative values recorded at each monthly cutoff. The table stops at month 3, the status date; it makes no claim about the eventual completion date.
| Reporting cutoff | Planned value | Earned value | Actual cost |
|---|---|---|---|
| Month 1 | $10,000 | $8,000 | $10,000 |
| Month 2 | $25,000 | $20,000 | $25,000 |
| Month 3: status date | $50,000 | $40,000 | $50,000 |
At month 3, the plan calls for $50,000 of budgeted accomplishment. The project has earned $40,000 and incurred $50,000. Planned progress is 50% of BAC, earned progress is 40%, and actual expenditure is 50% of BAC.
The earned-progress gap is 10 percentage points, calculated as 50% − 40%. It is not evidence that the finish date is 10% late. Different activities carry different budget weights, and their positions in the network affect the completion date differently.
The chart's vertical gaps are also straightforward. Schedule variance, EV − PV, is −$10,000. Cost variance, EV − AC, is −$10,000. Here the gaps happen to match, but one compares accomplishment with plan and the other compares accomplishment with cost.
Use ratios without changing their meaning
For the status-date example, schedule performance index is EV / PV = 40,000 / 50,000 = 0.800. Cost performance index is EV / AC = 40,000 / 50,000 = 0.800.
SPI says the project has earned 80 cents of budgeted accomplishment for each dollar scheduled. CPI says it has earned 80 cents of budgeted accomplishment for each dollar incurred. Neither means that the project is 80% complete; earned progress remains 40% of BAC.
The earned value calculator checks these variances and indices. Its illustrative curve should not be mistaken for the historical monthly table above: a single set of BAC, PV, EV and AC inputs does not reveal the path taken to reach those totals.
A cost forecast adds another assumption. If current cost efficiency continues, EAC = BAC / CPI = 100,000 / 0.8 = $125,000. Remaining forecast cost is $75,000, calculated as EAC minus the $50,000 already incurred. These are conditional forecasts, not new authorized budgets and not evidence of a completion date.
Build earned progress from defensible weights
A smooth EV line is worthless if the underlying completion judgments are casual. Define how each work package earns credit before reporting begins. Suitable methods can include accepted installed quantities, weighted milestones or objective completion rules. The method should fit the work and be applied consistently.
Consider two packages. Package A carries 60% of the budget weight and is 50% complete; package B carries 40% and is 25% complete. Their contributions are 0.60 × 50% = 30 percentage points and 0.40 × 25% = 10 percentage points. Total weighted progress is 40%.
With the example BAC of $100,000, that produces EV of $40,000. A simple average of the package completion percentages would give 37.5%, which would ignore their different weights.
Use the weighted progress calculator to check the aggregation. To translate its result into earned value, the weights must represent the relevant budget allocation. Weights based on labor hours, strategic importance or subjective difficulty may be useful for another progress index, but do not automatically produce budget-based EV.
Compare slopes as well as cumulative gaps
A cumulative line hides the detail inside each period. Subtract successive cutoffs to inspect recent performance. In the illustrative table, month 3 adds $25,000 of planned value, $20,000 of earned value and $25,000 of actual cost.
The earned line is rising, so work is being accomplished. Yet it is rising more slowly than the planned line during that interval, so the cumulative accomplishment gap widens. Positive progress is not the same as catching up.
A steeper cost slope can reflect mobilization or equipment delivery rather than a sudden collapse in field productivity. Investigate commitments, accruals, work-package records and accepted quantities before assigning a cause. Curve separation identifies a question; it does not answer the question by itself.
Do not manufacture a classic S shape. Slow mobilization, a productive middle and tapering closeout often produce one, but shutdowns, phased handovers and procurement milestones can produce steps or irregular profiles. A faithful irregular curve is more useful than a polished fiction.
Do not convert a currency gap directly into days
An EV line below PV signals less budgeted accomplishment than planned at the cutoff. It does not identify which unfinished activities control the finish. A small budget package can sit on the critical path, while a large noncritical package can dominate the chart.
A horizontal comparison can locate when the plan expected the current earned value to have been reached, provided the baseline supports meaningful interpolation. Even then, that comparison is not a replacement for a current logic-driven schedule forecast.
Near completion, conventional SPI can approach one as all budgeted work is finally earned, even when the project finishes late. Retain milestone dates, remaining durations and network analysis alongside the curve. The cost-and-value view and the time-and-logic view are complementary controls.
For a separate generator check, choose four periods, a $100,000 budget and the balanced shape. The modeled cumulative plan reaches $50,000 at period 2 and $100,000 at period 4. Entering incremental actual costs of $10,000, $15,000 and $25,000 produces $50,000 recorded actual cost through period 3. This synthetic plan does not reproduce the monthly PV table above; it demonstrates the generator’s input conventions, not a validated baseline.
Keep the history auditable
Preserve the approved baseline and identify authorized changes separately. Quietly shifting PV to follow EV erases the evidence needed to understand performance. A revised baseline can be legitimate, but the reason, approval and relationship to the previous baseline should remain visible.
Keep forecasts visually distinct from actuals and state their assumptions. A planned value curve normally ends at BAC; actual cost may finish above or below it. Earned value reaches BAC when the defined scope is fully earned, not whenever spending reaches the budget limit.
End the reporting discussion with an assigned action: validate quantities, recover a constrained sequence, resolve an accrual or approve a scope change. The useful S-curve is the one that directs that investigation while keeping money spent, value earned and work scheduled unmistakably separate.
Calculators used in this guide
Frequently asked questions
Does actual cost show actual progress?
No. Actual cost measures incurred expenditure. Earned value measures completed work at its approved budget value; physical progress requires suitable quantities or completion rules.
Can the S-curve generator produce a complete earned-value history?
No. It generates a shaped plan and optional actual series. Its actual rows are incremental amounts. An EV history requires separate period-by-period accomplishment records and consistent budget weights.
Does SPI of 0.8 mean the finish will be 20% late?
No. SPI compares earned value with planned value at a cutoff. It is not a direct measure of time delay or a substitute for a current dependency-based schedule forecast.
When does weighted progress become earned value?
When the weights represent the approved budget allocation and completion credit follows the agreed measurement rules. Multiply the resulting completion fraction by the matching budget at completion.
Should every project curve have an S shape?
No. Procurement milestones, shutdowns and phased work can create steps or irregular profiles. Preserve the underlying evidence instead of smoothing it into an assumed shape.
Sources and standards
About the author
Dr. Hassan Khames Eliwa holds a PhD in Construction & Built Environment and has more than 20 years of international project controls experience. He is Director of Eliwa Project Controls Limited in Auckland and founder of PMMilestone.org and PMMilestone.com.
Buy me a coffee