Resource histograms and levelling: spot the peak early
Build a resource histogram, distinguish levelling from smoothing, and test whether a flatter labour plan is genuinely deliverable.
By Dr. Hassan Khames EliwaLast updated
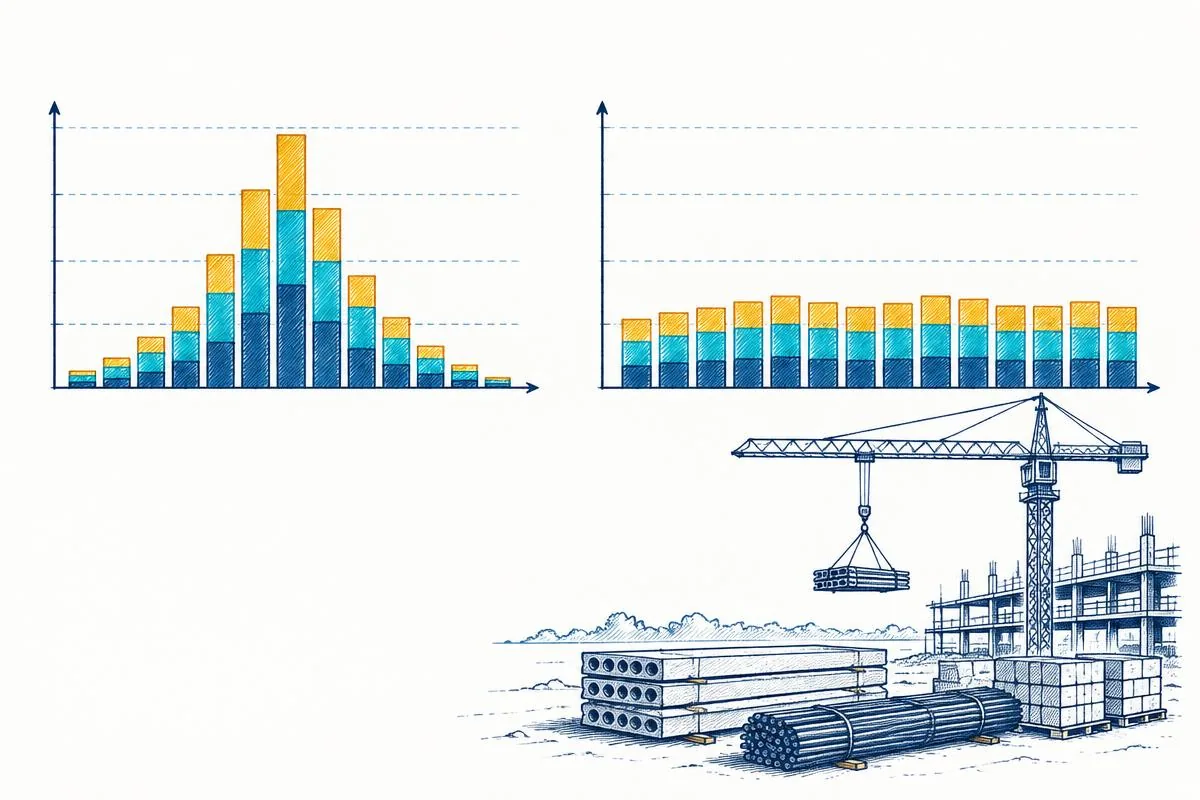
The peak is a promise the schedule must keep
A programme can satisfy every logical dependency and still require more electricians next Tuesday than the subcontractor can supply. The resource histogram makes that conflict visible. Its bars aggregate demand over time, allowing the planner and supervisor to discuss whether the proposed sequence is physically supportable.
The resource loading histogram calculator helps assemble demand by period. Before entering numbers, agree what the bars represent: people, labour-hours, machine-hours or another resource. A bar labelled “resources” is not enough to support a mobilisation decision.
This is an operating conversation rather than an exercise in making a chart look smooth. A deliberately high peak may be justified by a short access window. A flatter profile may postpone completion or move costs into additional supervision and temporary facilities.
Choose a common time and resource basis
Headcount and effort are related but different. Ten people on an eight-hour shift represent eighty labour-hours. Ten people on two different shifts may never occupy the workface together. A weekly total can therefore be acceptable while hiding an impossible daily or shift-level overlap.
Use separate resource codes for trades or equipment that cannot substitute for one another. Six general operatives do not automatically replace six certified welders. If the scarce item is a lifting team with a crane, model that team and crane as coordinated constraints rather than assuming spare total labour solves the problem.
The GAO Schedule Assessment Guide describes the importance of assigning resources and resolving resource constraints within a credible schedule. It also stresses that schedule changes have cost consequences. 1
A four-week loading example
Assume all work uses the same interchangeable trade, every week has five eight-hour working days, and assignments are constant within each week. Activity A requires six people in weeks one and two. Activity B needs eight in weeks two and three. Activity C needs four in weeks three and four.
| Week | Activity A | Activity B | Activity C | Total people | Weekly labour-hours | Capacity |
|---|---|---|---|---|---|---|
| 1 | 6 | 0 | 0 | 6 | 240 | 12 |
| 2 | 6 | 8 | 0 | 14 | 560 | 12 |
| 3 | 0 | 8 | 4 | 12 | 480 | 12 |
| 4 | 0 | 0 | 4 | 4 | 160 | 12 |
Total planned effort is 1,440 labour-hours, equivalent to 36 person-weeks at forty hours each. Average demand is nine people over four weeks, but the peak is fourteen. With twelve people available, week two exceeds capacity by two people or eighty labour-hours.
The spare capacity in week four cannot retrospectively rescue week two. Availability must coincide with the required work, and moving work requires permission from the network logic, workface readiness and contractual milestones.
Distinguish smoothing from levelling
In common planning usage, resource smoothing adjusts activities within available float while preserving the required completion date. Resource levelling resolves resource limits and may change completion or the critical path. Terminology can vary between scheduling tools, so state the constraints and permitted outcome rather than relying on the menu label.
Suppose B can start one week later without violating its predecessors, and its successor is not required until the end of week four. Moving B to weeks three and four produces a profile of 6, 6, 12, 12 people. Peak demand falls from fourteen to twelve, while effort remains 1,440 hours.
That move uses B's available scheduling flexibility. It is only legitimate because this example explicitly permits the later handover. If B originally had to finish in week three for a critical successor, the same shift would delay that successor. A visually improved histogram would then conceal a changed delivery promise.
Recalculate the whole network after a move
Do not move activity bars independently of their relationships. Check predecessors, successors, working calendars, inspection hold points and shared access. A week-long shift of installation can affect testing, deliveries, scaffold removal and another contractor's mobilisation.
A resource-constrained sequence may create a new controlling path even when the original logical critical path remains visible. Save the unlevelled schedule and the constraints used for levelling. That makes it possible to distinguish a delay caused by resource scarcity from one caused by changed physical logic.
Do not conserve effort by assumption when changing methods
Simply changing an activity's start date can leave its planned hours unchanged. Changing its crew size or shift pattern is a different intervention. Smaller crews may work efficiently in tight spaces, but they may also fall below the minimum team needed for safe handling or supervision.
Use the crew size and man-hours calculator to make effort and staffing assumptions explicit. Then use the activity duration calculator to test output-based duration. Neither calculation establishes that productivity scales linearly with headcount.
For example, stretching a fixed 320-hour task from eight people for five days to four people for ten days preserves arithmetic effort under eight-hour shifts. It does not prove the second method is safe, practical or compatible with the successor sequence. Validate the method before accepting the numerical equivalence.
Look below the weekly bar
In the example, week three requires twelve people throughout the week by assumption. Real assignments may concentrate. If two teams both need the same work area on Monday and leave it empty on Friday, the weekly total hides the clash.
Use weekly profiles for medium-range procurement and mobilisation decisions, then daily or shift-level profiles for near-term work. Include different holiday calendars, part-time specialists and planned maintenance for equipment. Reduce nominal availability when a known commitment removes capacity; do not count the same person as available on two projects.
Material availability also matters. A labour peak can be an artefact of an assumed bulk delivery that will actually arrive in stages. Link the work release to a credible delivery sequence rather than spreading labour arbitrarily to flatten the graph.
Compare options with more than peak headcount
Three options may all remove an overload: move work, hire a temporary team or introduce another shift. Compare their consequences openly. Moving work may consume float; hiring adds mobilisation and induction; a night shift may require additional supervision, lighting and permits.
In our example, hiring two extra people for week two supplies the missing eighty hours if those people can actually contribute at the assumed output. Moving B avoids that peak but uses scheduling flexibility. Neither is automatically cheaper once downstream effects and risk are included.
Record the decision basis in a small option log: changed activities, new finish date, additional cost, float consumed and unresolved dependencies. That is more useful than sending out a revised histogram with no explanation of what changed.
Track the plan against actual demand
After work starts, compare planned people, actual people, hours charged and accepted output. More people on site may indicate genuine acceleration, but it may also reflect waiting or rework. A histogram measures loading, not productivity or completion quality.
Preserve the approved baseline separately from the current forecast. If demand moves into later weeks, identify whether it represents delayed work, added scope or a revised method. Otherwise the apparent disappearance of an early peak can be mistaken for successful levelling when it is merely slippage.
Publish a profile people can act on
Issue the histogram with the status date, time bucket, shift assumptions, resource definitions and availability source. Highlight overloads, scarce skills and decisions still required. Name the owner of each capacity commitment rather than treating an unconfirmed recruitment plan as guaranteed supply.
A reliable resource plan remains connected to quantities, production assumptions and the network. The aim is not the lowest possible peak. It is a defensible match between when work must happen, who can perform it and what the rest of the project must give up to make that match possible.
Calculators used in this guide
Frequently asked questions
Does levelling always delay completion?
No. Available float may absorb the changes. When resource limits cannot be met within that flexibility, completion or intermediate milestones may move.
Can I average weekly headcounts to prove capacity?
An average describes total demand over the chosen horizon, not simultaneous demand. Check every relevant period against available capacity.
Should a histogram show people or hours?
Use people for concurrent staffing and hours for effort, with explicit shift assumptions. Where shift lengths vary, showing both prevents misleading comparisons.
Can unrelated trades share one capacity line?
Only if they genuinely draw from an interchangeable resource pool. Otherwise separate trades and scarce qualifications so that total labour does not hide shortages.
Does a level histogram mean high productivity?
No. A smooth loading profile can still contain waiting, rework or unrealistic outputs. Compare hours and staffing with accepted physical production.
Sources and standards
About the author
Dr. Hassan Khames Eliwa holds a PhD in Construction & Built Environment and has more than 20 years of international project controls experience. He is Director of Eliwa Project Controls Limited in Auckland and founder of PMMilestone.org and PMMilestone.com.
Buy me a coffee