Resource Loading Histogram Calculator
Aggregate overlapping resource assignments into an integer-period demand histogram. The calculator shows peak resource demand, its first period and total resource-unit-periods, while retaining empty periods so that the timing of mobilisation and gaps remains visible.
By Dr. Hassan Khames EliwaLast updated
Result
- Resource-unit-period total
- 18
- Periods
- 3
- First peak period
- 2
- 14.00
- 27.00
- 37.00
Uniform demand; periods before the first start remain zero.
| Period | Resource units |
|---|---|
| 1 | 4 |
| 2 | 7 |
| 3 | 7 |
How it works
Define a resource and a period
Each row contains start period, duration and resource units. A period might be a day, shift or week, but every row must use the same basis. Resource units can represent workers, equivalent full-time staff, cranes or defined crews; do not mix different resource types in one run. Fractional resource units are allowed for equivalent capacity allocations, while start and duration must be whole numbers. A crew allocation of 1.5 is meaningful only if the operational plan explains what that fractional capacity represents.
Load the occupied periods
An assignment starting in period s with duration d occupies periods s through s + d − 1, inclusive. Its resource demand is constant throughout that span. For every period, the calculator sums all active assignments. Period numbering begins at one, and zeros before the first start are preserved. The final period is the latest assignment finish, including any zero-unit assignment. The model does not interpret dates, weekends, public holidays or partial shifts.
Interpret peak and area
Peak demand is the largest combined period load, not the sum of each activity’s separate peak. The first peak period identifies the earliest occurrence when the maximum repeats. Total resource-unit-periods is the sum of the histogram bars, equivalently the sum of duration × resource units across all assignments. If units are workers and periods are equal eight-hour days, multiply that total by eight to obtain planned worker-hours. If units are cranes and periods are weeks, the total is crane-weeks instead.
Respect the operational limits
The input accepts at most 200 rows, with no header or thousands separators. Starts and durations must be positive integers, the final occupied period cannot exceed 1,000, and each resource quantity must lie between zero and one million. These bounds limit chart size and computational work. The histogram is an aggregation tool, not a resource-leveling algorithm: it neither moves activities nor checks logic, float, skills, availability or contractual milestones.
Worked example
Scenario 1: overlapping crews
Enter 1,3,4 and 2,2,3 on separate lines. The first assignment uses four resource units during periods one through three. The second adds three units in periods two and three. The histogram is therefore 4.00, 7.00, 7.00. Peak demand is 7.00 units, first occurring in period 2. Total demand is 4 × 3 + 3 × 2 = 18.00 resource-unit-periods, spread across 3 integer periods. If these are workers on eight-hour days, the corresponding planned effort is 144 worker-hours.
Scenario 2: a gap and fractional capacity
Enter 2,2,1.5 and 4,1,2. The four bars are 0.00, 1.50, 1.50 and 2.00. Peak demand is 2.00, first occurring in period 4, and total demand is 5.00 resource-unit-periods. Period one remains visible rather than shifting the first assignment left. Fractional capacity is retained because resource units are measurements, whereas the number of periods and first peak period are displayed as integers.
Expert tips
Common mistakes
- Do not include the finish period twice. Start 2 with duration 3 occupies periods 2, 3 and 4, not period 5.
- Do not confuse lower peak demand with lower effort. Moving an unchanged assignment can flatten the chart while leaving its resource-unit-period total exactly the same.
- Do not assume fractional average staffing is deployable on site. Half a crane or a specialist spread across simultaneous locations may require a different practical assignment plan.
Frequently asked questions
Does this calculator level resources?
No. It totals the demand implied by your rows. To test leveling, revise activity starts in a feasible programme and compare the resulting histogram.
Are start and duration allowed to be fractional?
No. Both must be positive whole periods. Choose a smaller period, such as a half-day shift, if that resolution is necessary for your plan.
Can resource units be fractional?
Yes. Equivalent staffing and shared capacity may be fractional. Physical indivisible equipment should still be entered as whole quantities according to the actual deployment plan.
How are idle periods represented?
Every period from one to the latest finish is included. Any period without active demand is a zero-height bar and a zero-valued table row.
What if the peak occurs twice?
The result reports the first period at the maximum. All other occurrences remain visible in the histogram and table, allowing you to inspect the full peak duration.
Does the total equal payroll hours?
Only after converting periods to paid hours and confirming that resource units represent individual workers. Overtime premiums, breaks and productivity losses require separate assumptions.
Related calculators
Related guides
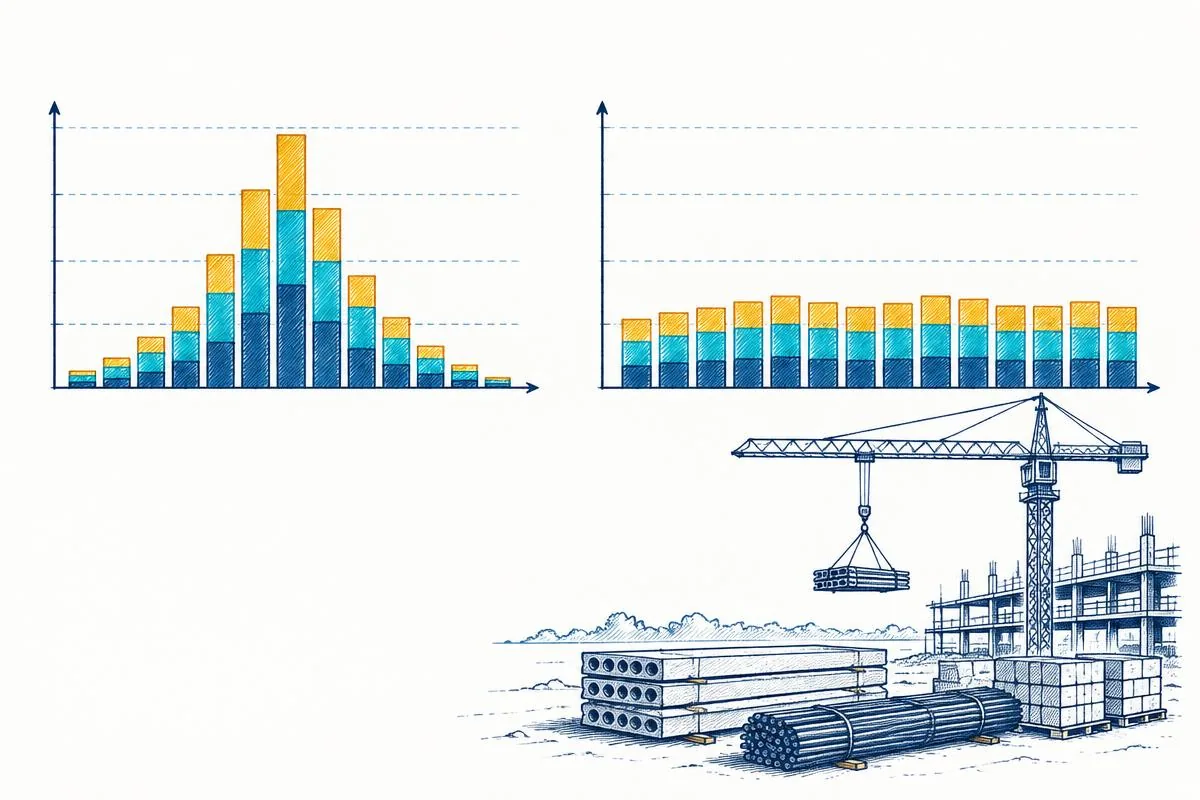 Construction & ProjectResource histograms and levelling: spot the peak earlyBuild a resource histogram, distinguish levelling from smoothing, and test whether a flatter labour plan is genuinely deliverable.16 November 2026 · 8 min read
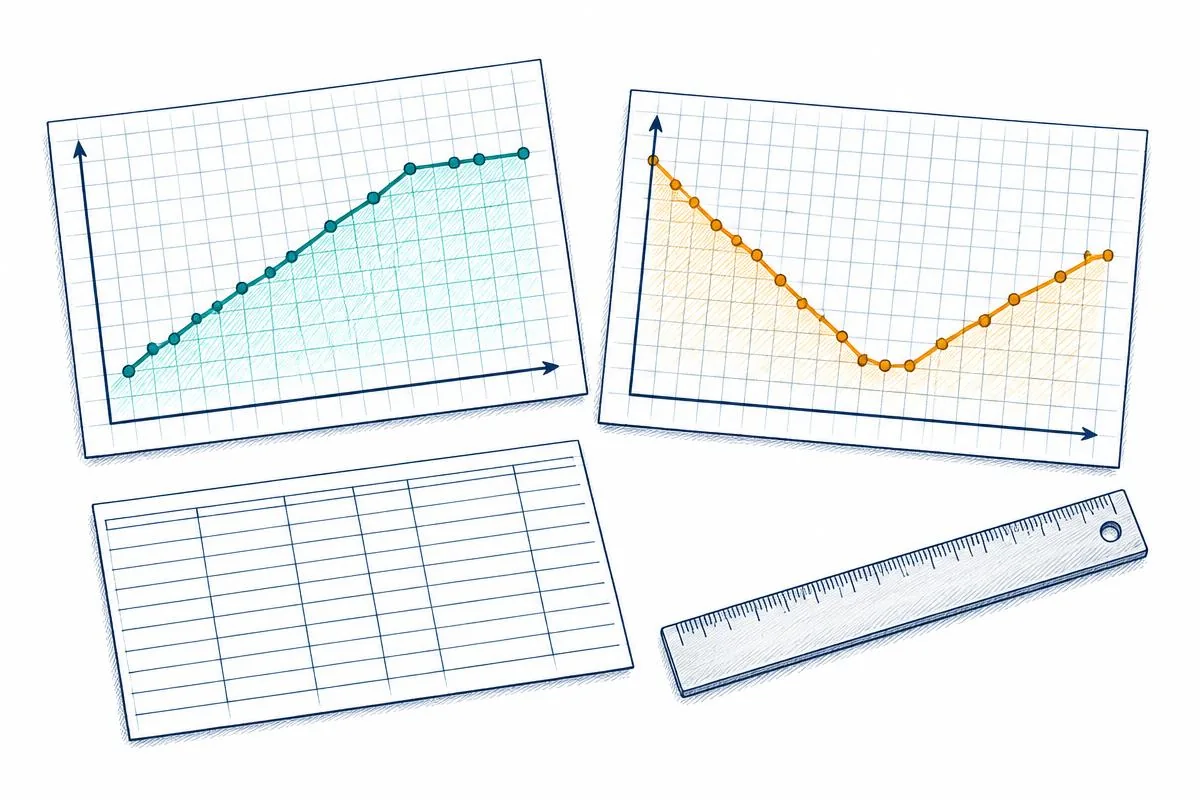 Construction & ProjectCPI and SPI trends: read the direction, not just the numberRead period and cumulative CPI and SPI together, test the data behind changing trends, and turn earned-value signals into practical decisions.16 November 2026 · 8 min read
 Construction & ProjectCrew size, man-hours and productivity: labour arithmeticConvert scope and production rates into labour-hours and crew sizes, then test utilization, whole-shift bookings and labour cost.16 November 2026 · 8 min read
Sources and standards
About the author
Dr. Hassan Khames Eliwa holds a PhD in Construction & Built Environment and has more than 20 years of international project controls experience. He is Director of Eliwa Project Controls Limited in Auckland and founder of PMMilestone.org and PMMilestone.com.
Buy me a coffee