Learning Curve Calculator
Apply Wright’s cumulative-average learning model to repeated construction units. The calculator separates average hours per unit, cumulative total hours and the incremental hours attributable to the latest unit so those three measures cannot be mistaken for one another.
By Dr. Hassan Khames EliwaLast updated
Result
- Cumulative average
- 64.000 hours/unit
- Incremental unit time
- 45.369 hours
- Exponent b
- -0.322
How it works
Choose genuinely comparable repetitive work
A learning curve is most defensible for repeated assemblies with similar scope, stable methods and a reasonably continuous crew. Apartment bathroom pods, repeated formwork cycles and standard equipment skids may fit that description better than unique one-off structures. Define the unit before entering the first-unit time. Changing the unit halfway through a forecast breaks the connection between production count and the observed opportunity to learn, even if the resulting graph still looks smooth.
Use the doubling interpretation correctly
The learning percentage describes the cumulative average after production doubles. With an 80 percent rate, the average at two units is 80 percent of the first-unit time; the average at four is 80 percent of that two-unit average. It does not say that every successive unit takes 20 percent less time than the preceding one. Confusing those interpretations can lead to implausibly small labor allowances near the end of a repetitive package.
Keep Wright separate from unit-time models
The exponent b equals log(rate / 100) divided by log(2). Wright cumulative average is a × n^b, where a is first-unit hours. Cumulative total is a × n^(b + 1). Incremental time for unit n is the difference between cumulative totals at n and n minus one, with the total at zero defined as zero. A different model that applies a × n^b directly to individual unit times is not being used.
Respect the supported rate boundary
Rates from 50 to 100 percent are accepted, and the unit count must be an integer from one to one million. The lower boundary prevents a decreasing cumulative total, which would imply negative work for later units. At exactly 50 percent the total remains constant after the first unit, leaving zero incremental hours for subsequent units. That is a mathematical boundary case rather than a credible long-run construction production forecast.
Build a budget around observed constraints
The result represents modeled effort, not elapsed completion time. Crew size, working hours, access windows and curing requirements still govern duration. First-unit hours may include setup or training that will not recur, but a new mobilization can restore some of those costs. Compare the curve against measured early cycles and reset assumptions when design changes, turnover or interrupted workflows disrupt learning. Treat hours saved as a forecast to verify rather than an automatic tender discount.
Worked example
Two distinct learning assumptions
With first-unit time 100 hours, learning rate 80% and cumulative count four, b is approximately −0.321928. Cumulative average is 64.000 hours per unit, cumulative total is 256.000 hours and incremental fourth-unit time is 45.369 hours. The third-unit cumulative total is approximately 210.631 hours.
At a 100% learning rate with the same first-unit time and four units, b is zero. Average remains 100.000 hours, total is 400.000 hours and the fourth unit requires 100.000 additional hours. The no-learning case is tested separately rather than inferred from a rounded exponent.
Expert tips
Common mistakes
- Calling cumulative average the latest-unit time.
- Applying the doubling percentage to each successive unit.
- Converting effort to duration without considering crew capacity.
Frequently asked questions
Does 80% mean an 80% saving?
No. It means cumulative average hours become 80 percent of their previous value whenever cumulative production doubles. The implied reduction per doubling is 20 percent.
Can I use fractional unit counts?
No. Use whole completed units because the latest-unit difference is calculated between adjacent integer production counts. Partial work needs a separate measurement rule.
Are these crew hours or person-hours?
Either can be used if the first-unit input and every comparison use the same definition. Do not compare a crew-hour forecast with payroll person-hours without conversion.
Why is incremental time below the average?
Earlier units were slower under a learning assumption. The cumulative average retains those early hours, while the latest-unit difference reflects the lower marginal effort later in production.
Can I convert this directly to days?
Only after defining crew capacity and nonworking constraints. Divide comparable effort by productive capacity, then account separately for mandatory waits, interfaces and access restrictions.
When should the curve be reset?
Consider a new baseline after major design changes, a replacement crew or a long interruption. Keep the original observation history so a reset does not disguise poor performance.
Related calculators
Related guides
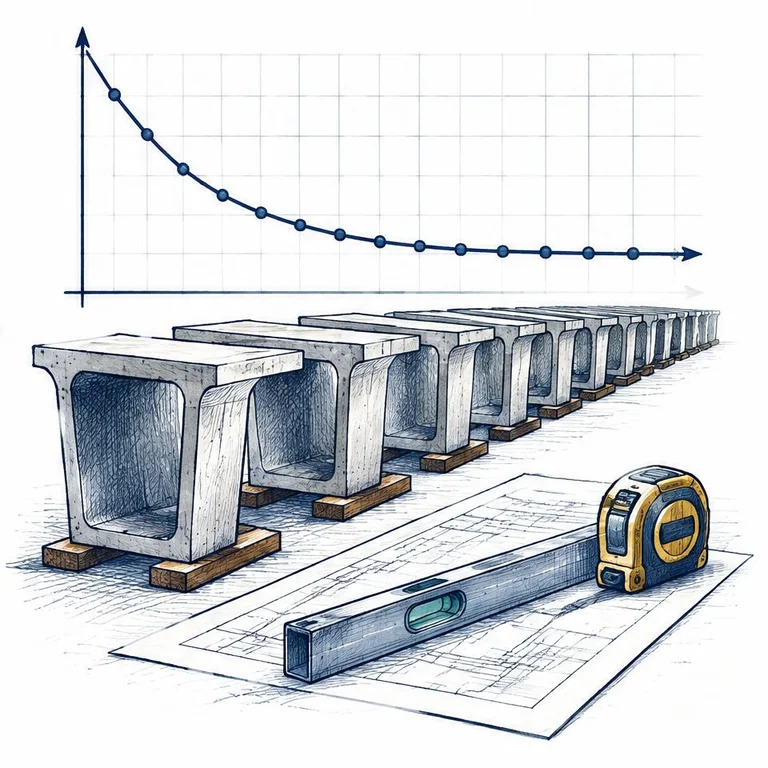 Construction & ProjectLearning curves in construction: averages vs unitsApply Wright cumulative-average learning curves, verify incremental unit effort, and translate repeatable work into duration and labour cost.15 November 2026 · 8 min read
 Construction & ProjectMeasuring physical progress: weighted milestones versus percent completeUse evidence-based milestones and stable weights to report completed work without confusing expenditure with physical progress.15 November 2026 · 8 min read
Sources and standards
About the author
Dr. Hassan Khames Eliwa holds a PhD in Construction & Built Environment and has more than 20 years of international project controls experience. He is Director of Eliwa Project Controls Limited in Auckland and founder of PMMilestone.org and PMMilestone.com.
Buy me a coffee