Learning curves in construction: averages vs units
Apply Wright cumulative-average learning curves, verify incremental unit effort, and translate repeatable work into duration and labour cost.
By Dr. Hassan Khames EliwaLast updated
Decide what repeats before choosing a curve
A construction learning curve models how effort may change as a team repeats comparable work. It can support estimates for repeated rooms, assemblies, bays or installation packages. It does not guarantee that each successive floor will finish faster, and it does not turn every construction activity into factory production.
Define the repeatable unit before entering a percentage: one accepted bathroom pod connection, for example, rather than a floor containing a changing mix of rooms. Keep scope, quality requirements and measurement boundaries consistent. A declining average is meaningful only when the units being averaged are reasonably comparable.
Use the learning curve calculator for repeated construction work after identifying whether its selected model describes cumulative averages or individual units. NASA's Cost Estimating Handbook provides an authoritative cost-estimating reference and supporting appendices; model choice and the quality of the supporting data remain estimator responsibilities. 3
Wright's model describes a cumulative average
In the Wright cumulative-average formulation, let a be the effort for the first unit, N the cumulative number of completed units, and r the learning-curve ratio expressed as a decimal. The exponent is b = ln(r) / ln(2). Cumulative average effort is A(N) = a × N^b, and cumulative total effort is T(N) = N × A(N).
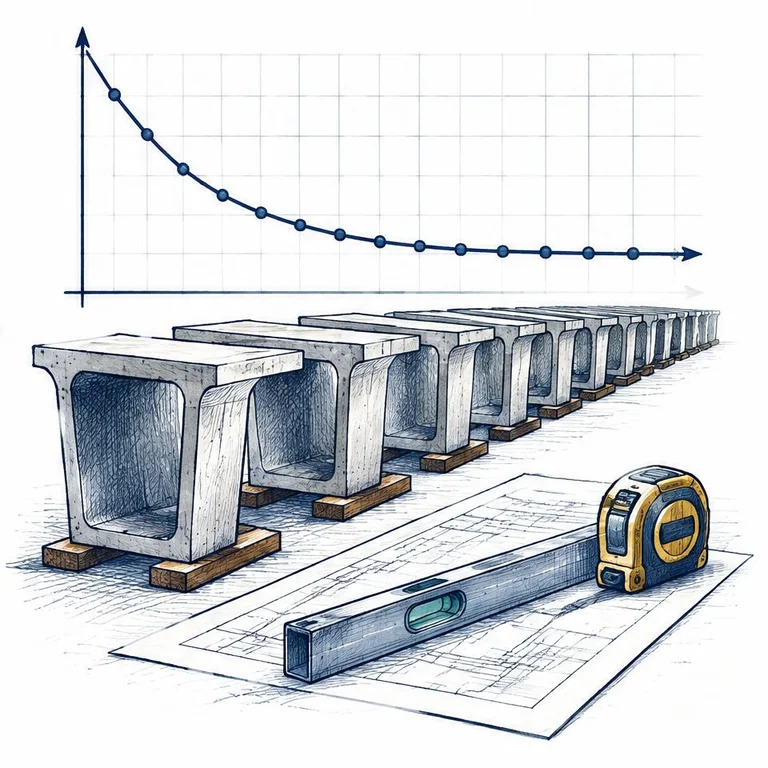
An 80% curve means the cumulative average becomes 80% of its previous value whenever cumulative quantity doubles. It means a 20% reduction at a doubling, not an 80% reduction. The percentage does not mean that every individual unit takes 80% of the immediately preceding unit's effort.
NASA's cost-estimating training distinguishes unit and cumulative-average formulations. Their equations can look deceptively similar while assigning the dependent variable a different meaning. Keep that definition beside the formula whenever results move between spreadsheets, estimates and reports. 2
For this guide, effort is measured in worker-hours. A worker-hour is one person's hour of work, not necessarily one hour elapsed on the programme. Nonrecurring design, mobilization or training should be identified separately unless the dataset and model intentionally include them.
Verify the ten-hour, eighty-percent example
Assume a = 10 worker-hours and r = 0.80 for comparable repeated installation units. The exponent is approximately −0.3219280949. At each doubling, multiply the cumulative average by 0.80. This gives a simple independent check on the power formula.
| Completed units N | Cumulative average A(N), worker-hours/unit | Cumulative total T(N), worker-hours |
|---|---|---|
| 1 | 10.00 | 10.00 |
| 2 | 8.00 | 16.00 |
| 4 | 6.40 | 25.60 |
| 8 | 5.12 | 40.96 |
Thus 8 at two units, 6.4 at four and 5.12 at eight are cumulative averages. The total for eight units is 40.96 worker-hours. Multiplying eight by the first-unit effort instead would give 80 worker-hours, which is the no-learning baseline, not the Wright forecast.
The modelled reduction from that baseline is 39.04 worker-hours, or 48.8% of 80. This is an arithmetic comparison under the stated assumptions, not an observed saving or an industry productivity statistic. It excludes any separately budgeted setup costs and says nothing by itself about wages, cash flow or critical-path completion.
Calculate the eighth unit from total differences
The eighth unit is not the eight-unit cumulative average. Under this cumulative-average model, incremental effort for unit N is U(N) = T(N) − T(N−1). Calculate totals at full precision before subtracting; premature rounding creates avoidable discrepancies in individual-unit values.
For seven units, T(7) = 10 × 7^(1+b) = 37.4142667259 worker-hours. Therefore unit eight requires 40.96 − 37.4142667259 = 3.5457332741 worker-hours, or approximately 3.546 worker-hours. Reporting 5.12 as unit-eight effort would confuse an average with an increment.
The total-difference method also gives the effort for a future batch. Subtract the cumulative total at the current accepted quantity from the cumulative total at the target quantity, using the same model and effort basis. Do not multiply all remaining units by the current cumulative average: that would generally ignore the curve's continuing change.
A unit model gives a different answer
A unit formulation instead sets individual unit effort to u(N) = a × N^b. Here, the learning ratio applies to the effort of the doubled unit number, not to the average of everything produced so far. The same 10-hour starting value and 80% ratio give unit eight an effort of 5.12 worker-hours in that model.
To calculate total effort under the discrete unit model, sum u(1) through u(8). That total is approximately 53.4591353327 worker-hours, not 40.96. Neither result is corrected by relabelling the other model's output; the underlying assumptions differ.
Choose the formulation to match the source data and intended interpretation. A curve ratio fitted to cumulative averages should not be inserted into a unit-model estimate as though nothing changed. Likewise, vendor shorthand such as “eighty-percent learning” is incomplete unless the model, starting basis and applicable range are stated.
Construction repeatability has boundaries
Learning is more credible when the same team repeats similar methods with stable drawings, tools, access and material supply. Changes in apartment layout, reinforcement density, tolerances, travel distance or inspection scope can alter effort independently of familiarity. Separate those effects before attributing every improvement to learning.
Crew turnover can interrupt knowledge retention. A long break can weaken continuity. A new tool or prefabrication method can change the process enough that the original curve is no longer a suitable description. Congestion and restricted work fronts can offset improvement even when individual workers become more proficient.
Treat reset conditions as explicit estimating assumptions, not universal thresholds. There is no single break length, turnover percentage or floor number that automatically resets every construction curve. Decide whether to continue, partially restart or establish a new series using project evidence, and retain the reason for that decision.
Translate effort into duration and cost carefully
Suppose all 40.96 worker-hours are shared by a stable two-person crew, with eight paid hours per person per working day. If work can be balanced perfectly and no separate waiting time is included, theoretical duration is 40.96 / (2 × 8) = 2.56 working days. This is a resource arithmetic scenario, not proof that every task can be divided evenly.
The activity duration calculator for quantity and crew output can reproduce that duration with quantity 8, rate basis day, one crew, eight hours per day, and an equivalent aggregate rate of 3.125 units per crew-day. That rate is 8 / 2.56 across the whole batch; it is not a forecast of constant output on each day.
For a cost bridge, assume base pay of 30 currency units per worker-hour, no overtime, 20% employer burden on wages and no fixed charges. Wages are 1,228.80, burden is 245.76, and loaded labour cost is 1,474.56. Enter two workers, 2.56 days and eight hours into the labour cost calculator for wages and employer burden with those pay assumptions.
Keep calendar constraints, curing, inspections and handoffs outside that simple conversion unless the effort model explicitly includes them. Avoid reducing hours for learning and then applying another productivity improvement derived from the same observations.
Update the estimate without forcing the fit
Collect accepted quantities and comparable effort consistently. Preserve raw records and explain adjustments for rework or exceptional events rather than deleting awkward observations. Compare actual cumulative totals with the forecast and investigate departures before selecting a steeper curve.
Show a no-learning case alongside the learning assumption when evidence is thin. Restrict extrapolation beyond the observed repetition range, especially when work conditions change. The useful deliverable is an estimate with traceable definitions, plausible limits and an update method—not a smooth curve that hides operational constraints.
Calculators used in this guide
Frequently asked questions
What does an 80% Wright learning curve mean?
Each doubling of cumulative quantity reduces the cumulative average effort to 80% of its previous value. It does not reduce every successive unit by 20%.
Is 5.12 worker-hours the eighth-unit effort in the example?
No. It is the cumulative average after eight units in the Wright model. Incremental eighth-unit effort is total effort at eight minus total effort at seven, approximately 3.546 worker-hours.
Can the same curve ratio be used in a unit model?
Only with an appropriate model definition and calibration. The same numerical ratio and first-unit effort generally produce different cumulative totals in unit and cumulative-average formulations.
When should a construction learning curve reset?
There is no universal reset threshold. Crew changes, interruptions, design changes or new methods may justify a partial restart or a new series when supported by project evidence.
Do fewer worker-hours guarantee a shorter programme?
No. Resource balance, work fronts, dependencies and fixed waiting times constrain elapsed duration. Translate effort into a resource plan before claiming schedule savings.
Sources and standards
About the author
Dr. Hassan Khames Eliwa holds a PhD in Construction & Built Environment and has more than 20 years of international project controls experience. He is Director of Eliwa Project Controls Limited in Auckland and founder of PMMilestone.org and PMMilestone.com.
Buy me a coffee