Standard deviation without the jargon
The average tells you the centre. Standard deviation helps describe the spread, provided you know what the data represents.
By Dr. Hassan Khames EliwaLast updated
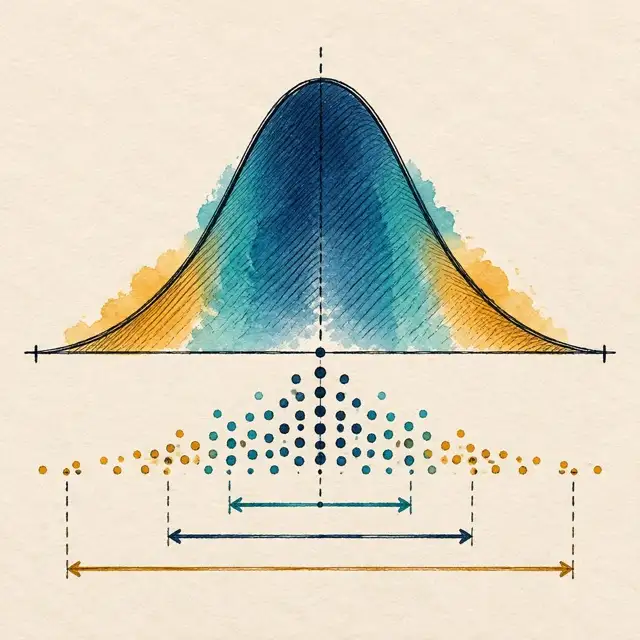
The average does not tell you how consistent the results are
Two crews can average the same installation time while producing very different day-to-day results. One may finish close to the average almost every time. The other may alternate between unusually quick work and major delays.
Standard deviation describes how spread out numerical observations are around their mean. A small value indicates relatively close clustering; a larger value indicates wider dispersion.
It is useful for comparing consistency, checking processes and understanding uncertainty. It does not explain why variation exists, and it does not automatically tell you what will happen next.
Start with the average calculator to establish the centre. Then use the standard deviation calculator to describe the spread.
Same mean, different behavior
Consider two sets of task durations, measured in minutes:
| Dataset | Observations | Mean | Population standard deviation |
|---|---|---|---|
| A | 8, 9, 10, 11, 12 | 10 minutes | 1.414 minutes |
| B | 0, 5, 10, 15, 20 | 10 minutes | 7.071 minutes |
Both average ten minutes. Dataset B is much less tightly grouped.
The zero in this deliberately simple illustration is a numerical value, not a missing-data marker. In real duration records, a zero would deserve investigation before calculation.
A mean alone would conceal the difference between these datasets. Reporting the spread makes the operational question visible: can the next operation rely on steady output, or must it cope with substantial variability?
The right answer depends on the context. A small timing variation may matter greatly in a tightly coordinated production line and hardly matter at all in a flexible administrative task.
Build the calculation from familiar steps
Take Dataset A: 8, 9, 10, 11 and 12.
First calculate the mean. Their sum is 50, and 50 / 5 = 10.
Next subtract the mean from each observation. The deviations are −2, −1, 0, 1 and 2.
Simply averaging those deviations would not work: the negative and positive values cancel. Standard deviation avoids that cancellation by squaring each deviation.
| Observation | Deviation from mean | Squared deviation |
|---|---|---|
| 8 | −2 | 4 |
| 9 | −1 | 1 |
| 10 | 0 | 0 |
| 11 | 1 | 1 |
| 12 | 2 | 4 |
| Total | 0 | 10 |
For the population calculation, divide the squared-deviation total by the number of observations: 10 / 5 = 2. This is the population variance.
Finally, take the square root: the square root of 2 is approximately 1.414. That is the population standard deviation.
Squaring handles cancellation; the square root returns the result to the original measurement unit.
Population and sample answer different questions
Use the population calculation when the observations constitute the complete group you intend to describe.
Use the sample calculation when the observations are a sample used to estimate variability in a larger population or ongoing process, subject to appropriate sampling assumptions.
The sample formula divides the squared-deviation total by n − 1, rather than n. For Dataset A:
- Population variance: 10 / 5 = 2.
- Population standard deviation: 1.414, rounded.
- Sample variance: 10 / 4 = 2.5.
- Sample standard deviation: 1.581, rounded.
The adjustment addresses the downward bias in the straightforward sample-based variance estimate when the unknown population mean is estimated from the same data. It does not make a poor or unrepresentative sample reliable.
A sample standard deviation requires at least two observations. With only one, there is no independent information about spread around an estimated mean.
Keep the units visible
If observations are measured in minutes, standard deviation is measured in minutes. Variance is measured in minutes squared.
That makes standard deviation easier to interpret operationally. “Spread of about 1.4 minutes” is more intuitive than a variance expressed in squared minutes.
Changing measurement units changes the numerical standard deviation. Dataset A's population standard deviation is approximately 84.85 seconds, because the unrounded value in minutes is multiplied by 60.
Adding a fixed constant to every observation shifts the mean but leaves the standard deviation unchanged. Multiplying every observation by a constant multiplies the standard deviation by the absolute value of that constant.
These properties help when checking unit conversions and transformed data.
Outliers can move the result substantially
Replace the final observation in Dataset A with 22. The new dataset is 8, 9, 10, 11 and 22.
Its mean becomes 12, and its population standard deviation becomes approximately 5.099. The squared deviations sum to 130, giving a population variance of 26.
That one high observation changes both the centre and the spread.
Do not delete it merely because it is inconvenient. Check whether it is a transcription error, a different task type or a genuine disruption that belongs in the data.
If it is real, the outlier may be the most useful observation in the set. It could reveal an access problem, equipment failure or exceptional operating condition.
For strongly skewed data, report the median and relevant percentiles alongside the mean and standard deviation. The NIST Engineering Statistics Handbook discusses several measures of scale because no single summary suits every dataset.
A standard deviation is not a universal prediction band
The familiar statement that roughly 68% of observations fall within one standard deviation of the mean applies to a normal distribution. The corresponding approximate proportions within two and three standard deviations are about 95% and 99.7%.
Do not apply those proportions automatically to any dataset.
Durations, costs and waiting times can be skewed. Mixed populations can have several clusters. Small datasets provide limited evidence about the shape of the underlying distribution.
A mean-minus-standard-deviation calculation can even produce an impossible negative duration. That is a warning about the model, not evidence that negative task times are possible.
Do not confuse spread with uncertainty in the mean
Standard deviation describes variability among observations. Standard error describes the sampling uncertainty of an estimated mean under a statistical model.
For independent observations with a common finite variance, the estimated standard error of the mean is the sample standard deviation divided by the square root of the sample size.
For example, a sample standard deviation of 10 units across 25 observations gives an estimated standard error of 2 units.
That does not mean individual observations now vary by only two units. It means the estimated average is more stable than an individual observation under those assumptions.
Use the right spread for the right decision
Observed standard deviation comes from recorded data. The range-based spread in traditional PERT is different: it is an approximation derived from optimistic and pessimistic estimates.
Use the PERT calculator when structuring uncertain activity-duration judgments. Do not treat its estimated spread as if it were the measured sample standard deviation of completed activities.
Before comparing two reported standard deviations, check that the datasets use the same units, task definitions, sampling approach and operating conditions.
For operational decisions, report the mean, the chosen standard deviation, the observation count and any important exclusions together. That small amount of context prevents a tidy statistic from making a messy process look better understood than it really is.
Calculators used in this guide
Frequently asked questions
Can standard deviation be negative?
No. Standard deviation is zero or positive. A negative result indicates a calculation or software-use error.
What does a standard deviation of zero mean?
It means all included observations are identical. It does not prove that the wider process will always produce the same result.
Should I choose sample or population standard deviation?
Choose based on the question. Use population standard deviation to describe the complete group of interest, and sample standard deviation when estimating a wider population's variability from a sample.
Does a low standard deviation mean good performance?
Not necessarily. A process can be consistently slow, expensive or inaccurate. Standard deviation describes spread, not whether the average result meets the requirement.
Can I compare standard deviations measured in different units?
Not directly. Convert to consistent units first. Relative measures such as the coefficient of variation can sometimes help, but require a meaningful ratio scale and a suitable nonzero mean.
Sources and standards
About the author
Dr. Hassan Khames Eliwa holds a PhD in Construction & Built Environment and has more than 20 years of international project controls experience. He is Director of Eliwa Project Controls Limited in Auckland and founder of PMMilestone.org and PMMilestone.com.
Buy me a coffee