PERT Calculator
This PERT calculator turns optimistic, most-likely and pessimistic task durations into a weighted mean, standard deviation and approximate P50, P80, P90 and P95 durations. It also compares the triangular mean and can combine up to five independent serial tasks by summing their means and combining their uncertainty by root-sum-square.
By Dr. Hassan Khames EliwaLast updated
Result
- Standard deviation
- 2.000 days
- Triangular mean
- 9.000 days
- P50 (normal approximation)Independent serial tasks; percentiles are not guarantees or bounded PERT quantiles.
- 8.000 days
- P80 (normal approximation)Independent serial tasks; percentiles are not guarantees or bounded PERT quantiles.
- 9.683 days
- P90 (normal approximation)Independent serial tasks; percentiles are not guarantees or bounded PERT quantiles.
- 10.563 days
- P95 (normal approximation)Independent serial tasks; percentiles are not guarantees or bounded PERT quantiles.
- 11.290 days
Task calculations (days)
| Task | O | M | P | PERT mean | SD |
|---|---|---|---|---|---|
| 1 | 4.000 | 7.000 | 16.000 | 8.000 | 2.000 |
How it works
Define three estimates for the same scope
O is an optimistic duration under favorable but credible conditions. M is the most likely duration, not the midpoint by definition. P is a pessimistic duration for the same work under adverse conditions. Enter all three in days using one consistent calendar convention, and keep the scope and resource assumptions fixed. The calculator requires 0 ≤ O ≤ M ≤ P; equal estimates represent a task treated as certain.
The classic PERT approximation uses mean = (O + 4M + P) ÷ 6 and standard deviation = (P − O) ÷ 6. The most likely estimate receives four times the weight of either endpoint. The triangular comparison uses (O + M + P) ÷ 3. A substantial difference between these two means is a prompt to examine skew and endpoint assumptions, not evidence that either distribution is correct.
Convert uncertainty into planning percentiles
The displayed percentiles use a normal approximation: duration = mean + z × standard deviation. The z values are 0 for P50, approximately 0.841621 for P80, 1.281552 for P90 and 1.644854 for P95. A P80 duration is a model-based duration with roughly an 80% probability of completion by that point if the assumptions hold. It is not a promise and is not an 80% confidence interval for an unknown mean.
This approximation is deliberately simple. A normal distribution is unbounded, whereas a single-task beta or triangular distribution is bounded. Its upper percentiles can therefore exceed the entered pessimistic duration, especially with unusual estimate shapes. The calculator does not clip them: clipping would hide the model mismatch. For a highly skewed single activity, treat these numbers as screening estimates and consider a properly specified distribution or simulation.
Combine only independent serial work
In task-list mode, enter one O,M,P triple per line, with at most five lines and no headers. The list replaces the individual inputs. Means are added, and the combined standard deviation is the square root of the sum of squared task standard deviations. The comparison triangular means are added separately.
This aggregation assumes every listed task lies in sequence and task durations are independent. Parallel activities do not simply add. Shared weather, access restrictions, design approvals or a common crew may create correlation, making root-sum-square uncertainty too small. A real project network can also change critical path as durations vary; this calculator does not perform network scheduling or Monte Carlo analysis.
Worked example
One uncertain installation task
Enter O = 4 days, M = 7 days and P = 16 days. The PERT mean is (4 + 4 × 7 + 16) ÷ 6 = 8.000 days. Standard deviation is (16 − 4) ÷ 6 = 2.000 days, while the triangular mean is 9.000 days.
The normal-approximation outputs are P50 8.000 days, P80 9.683 days, P90 10.563 days and P95 11.290 days. If the team chooses a whole-day planning target, it should round the selected duration upward separately rather than assume the displayed decimal already includes calendar scheduling.
For a two-task check, enter lines 4,7,16 and 2,3,4. The combined mean is 11.000 days, the standard deviation is 2.028 days, and the triangular mean is 12.000 days. Adding the two standard deviations directly would overstate uncertainty under the independence assumption.
From the field
From Dr. Hassan Khames Eliwa's project controls experience
Commissioning is where I've seen single-point estimates hurt most. On one programme I worked on, the activity sat in the schedule as a flat 10 days, and nobody questioned it until we sat down with the supervisor. The figures below are simplified, but the shape is what we found: 8 working days if the vendor turned up on time, 10 with the usual coordination, 20 if vendor availability disrupted testing. Same scope, same crew. Enter O = 8, M = 10 and P = 20 in single-task mode.
The expected duration comes out at 11.333 days, about 11.33 days, with a standard deviation of 2.000 days. That pessimistic tail drags the mean past the most likely value. One standard deviation either side gives a rough band of 9.33–13.33 working days. I treat that as a range to argue about, not a guaranteed window or a calibrated probability.
The habit I kept: before anyone commits to a date, confirm the vendor booking and list what could interrupt testing. No amount of decimal places will get a technician on site.
Field quick reference
| Commissioning estimate | Working days |
|---|---|
| Optimistic | 8 |
| Most likely | 10 |
| Pessimistic | 20 |
| Expected duration | 11.333 |
Expert tips
Common mistakes
- P80 is not a guaranteed deadline. The result depends on subjective estimates and a normal approximation that may not fit the actual duration distribution.
- Adding parallel-task means produces an incorrect project duration. Work out dependencies and resource constraints before deciding which activities belong in a serial list.
- Mixing working days and elapsed days distorts the total. Convert to a common basis first, and apply weekends, holidays and shift calendars in the scheduling tool.
Frequently asked questions
Why is the PERT mean different from the triangular mean?
PERT gives the most likely duration extra weight, whereas the triangular mean weights all three inputs equally. Neither weighting scheme replaces evidence about the actual task distribution.
Can I enter decimal or zero durations?
Yes. Nonnegative decimal durations are accepted, including a zero-duration milestone. Estimates must still be ordered, and all three values must be present and finite.
Why is P50 equal to the mean?
The displayed percentiles use a symmetric normal approximation, whose mean and median coincide. This does not claim that the original task uncertainty is symmetric.
Does P95 mean a 95% chance the project will finish?
Only within the simplified duration model and its assumptions. Unmodelled scope, correlated risks, network logic and resource limits can invalidate that interpretation for a real project.
How do I turn the result into a finish date?
Apply the chosen duration to a start date using the correct working calendar and dependencies. The duration has no calendar attached; apply holidays, shifts and available float separately.
Related calculators
Related guides
 Construction & ProjectMonte Carlo schedule risk in plain English: what P50 and P80 actually meanRead schedule percentiles without confusing a serial simulation, a network forecast and a commitment.15 November 2026 · 8 min read
 Construction & ProjectThree-point estimating: when PERT beats a single guessA practical guide to three-point duration estimates, weighted averages and the limits of turning uncertain activities into a promised date.14 November 2026 · 7 min read
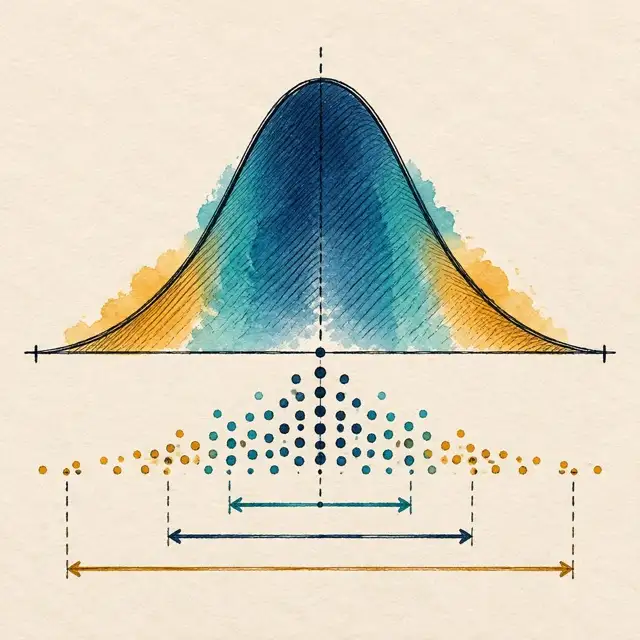 MathStandard deviation without the jargonThe average tells you the centre. Standard deviation helps describe the spread, provided you know what the data represents.14 November 2026 · 7 min read
 Construction & ProjectExpected monetary value: contingency you can defendBuild a probability-weighted risk allowance without mistaking expected loss for a guaranteed funding reserve.14 November 2026 · 8 min read
 Construction & ProjectEarned value management in plain English: CPI, SPI and what to do about themTurn planned value, earned value and actual cost into useful decisions without confusing budget performance with cash flow or time.14 November 2026 · 7 min read
Sources and standards
About the author
Dr. Hassan Khames Eliwa holds a PhD in Construction & Built Environment and has more than 20 years of international project controls experience. He is Director of Eliwa Project Controls Limited in Auckland and founder of PMMilestone.org and PMMilestone.com.
Buy me a coffee