
Project Cash Flow Forecast Calculator
This project cash-flow forecast calculator distributes cost and gross income across a monthly S-curve, delays receipts by a whole-month payment lag and withholds retention until a stated release month. It reports monthly net cash, cumulative cash and the peak month-end funding need.
By Dr. Hassan Khames EliwaLast updated
Result
- Final cumulative cash
- $20,000.00
- Total cash received
- $100,000.00
- Retention released at forecast end
- $5,000.00
Monthly cash forecast; receipts and costs at month end
| Month | Cost | Income | Net cash | Cumulative cash |
|---|---|---|---|---|
| 1 | $12,500.00 | $0.00 | -$12,500.00 | -$12,500.00 |
| 2 | $27,500.00 | $14,843.75 | -$12,656.25 | -$25,156.25 |
| 3 | $27,500.00 | $32,656.25 | $5,156.25 | -$20,000.00 |
| 4 | $12,500.00 | $32,656.25 | $20,156.25 | $156.25 |
| 5 | $0.00 | $14,843.75 | $14,843.75 | $15,000.00 |
| 6 | $0.00 | $5,000.00 | $5,000.00 | $20,000.00 |
How it works
Start with totals on a consistent basis
Enter total forecast cost and gross contract income in the same currency. Treat tax consistently because there is no separate tax account. Construction duration is a whole number of months. Payment lag shifts each month's earned income into a later receipt month; it does not delay the cost in that month. The model assumes costs are paid as incurred and provides no separate supplier-credit setting.
Understand the S-curve assumption
The cumulative planned share at fraction t of construction duration is F(t) = 3t² − 2t³. Each month's share is the difference between the curve at its end and start. Both costs and gross earned income use those same shares. This produces a gradual start, a busier middle and a tapering finish, but it is a generic profile rather than a programme-derived valuation.
Regular receipts equal earned income less the retention percentage and arrive after the payment lag. All withheld retention is released in the final forecast month, which is the last construction month plus payment lag plus the retention-release lag. A zero release lag places release in the same month as the final regular receipt. The release lag is therefore measured after that receipt, not directly after practical completion.
Read cash, not profit alone
Monthly net cash equals receipts less cost. Cumulative cash is the running sum from a zero opening balance. Peak funding need is the largest negative cumulative month-end balance expressed as a positive amount. It is not an intramonth overdraft limit: a large cost paid before a receipt within the same month can require more working capital than the chart shows.
The GAO Cost Estimating and Assessment Guide supports documenting estimate assumptions, while the Construction Supply Chain Payment Charter provides payment-practice context. Neither makes this illustrative receipt schedule a contractual entitlement. Use the retention payment calculator for a separate cumulative valuation check; this forecast has no monetary retention cap.
Worked example
Example: default four-month forecast
Enter $80,000 cost, $100,000 gross income, 4 construction months, a 1-month payment lag, 5% retention and a 1-month release lag. Monthly costs are $12,500, $27,500, $27,500 and $12,500, followed by zero costs. Receipts across the six forecast months are $0, $14,843.75, $32,656.25, $32,656.25, $14,843.75 and $5,000. Peak month-end funding is $25,156.25. Final cumulative cash is $20,000, total cash received is $100,000 and the final retention release is $5,000.
Example: immediate payment without retention
Use $80,000 cost and $100,000 income over 2 months, with zero payment lag, retention and release lag. Costs are $40,000 each month and receipts are $50,000 each month. Monthly net cash is $10,000; cumulative cash is $10,000 then $20,000. Peak month-end funding is $0 and retention released is $0.
Expert tips
Common mistakes
- Calling the final cumulative balance cash available today. It is the projected end position after all modelled receipts, including retention release, not the opening bank balance.
- Measuring the retention-release lag from construction completion. In this model it is additional to the regular payment lag and starts after the final regular receipt month.
- Using month-end funding need as an approved overdraft limit. The calculation does not capture daily sequencing, contingencies, lender conditions or other business cash commitments.
Frequently asked questions
Which S-curve is used?
The model uses the smoothstep cumulative curve stated above. It is deterministic and normalised over construction duration; it is not fitted to historical project data or a resource-loaded programme.
Does retention have a cap?
No. The selected percentage is withheld from every earned-income share, then released in full at forecast end. Use a more detailed schedule where the contract has a monetary cap or staged releases.
Can costs have a different curve?
Not in this simplified tool. Costs and gross earned income share one progress profile. Projects with advance procurement, milestone billing or front-loaded mobilisation need a separately prepared monthly cash schedule.
Can payment lag be fractional?
No. Duration and both lag inputs use whole months so each receipt maps to a defined row. Use a dated forecast outside this tool when weekly or daily timing materially affects funding.
What does the chart show?
It shows monthly net cash and cumulative cash in the selected money basis. The accompanying table exposes costs and receipts separately so you can reconcile each movement instead of reading only the final balance.
Does the forecast predict profit?
The final cash balance equals gross income less entered cost once every receipt arrives. It is not a full accounting profit calculation and omits any expenses, tax or finance charges absent from those totals.
Related calculators
Related guides
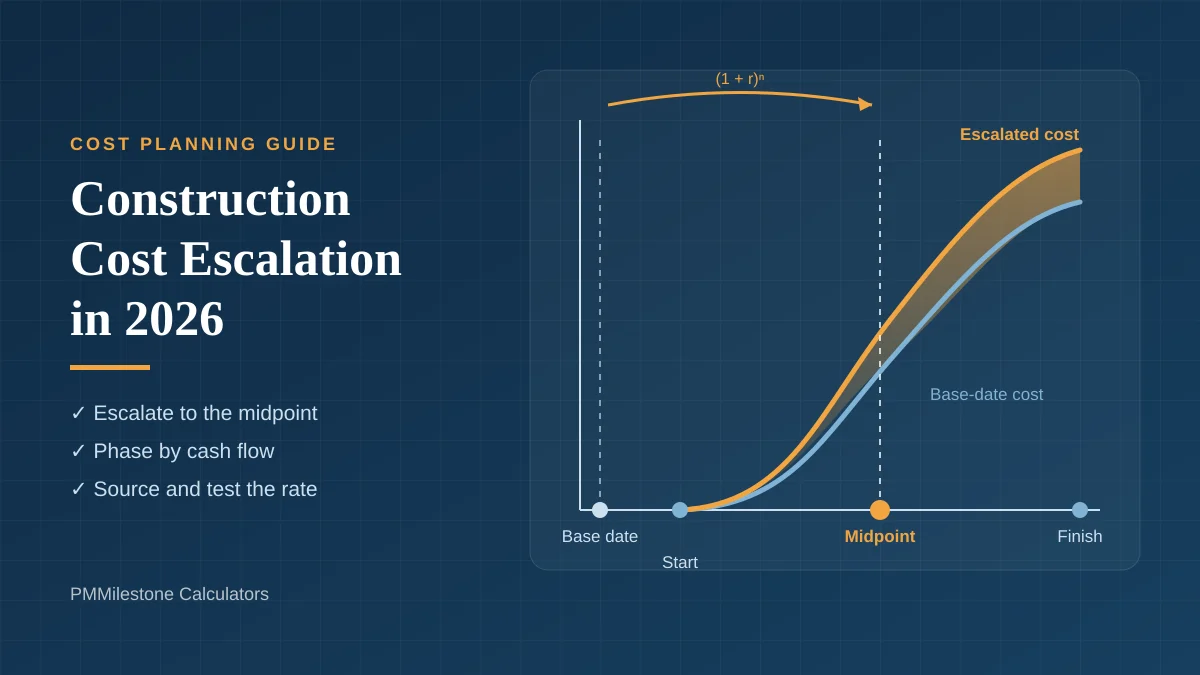 Construction & ProjectHow to Calculate Construction Cost Escalation in 2026: Midpoint, Cash Flow and Rate SelectionA practical method for escalating a base-date estimate: midpoint of construction, cash-flow phasing, rate sources, sensitivity, and common mistakes.17 November 2026 · 12 min read
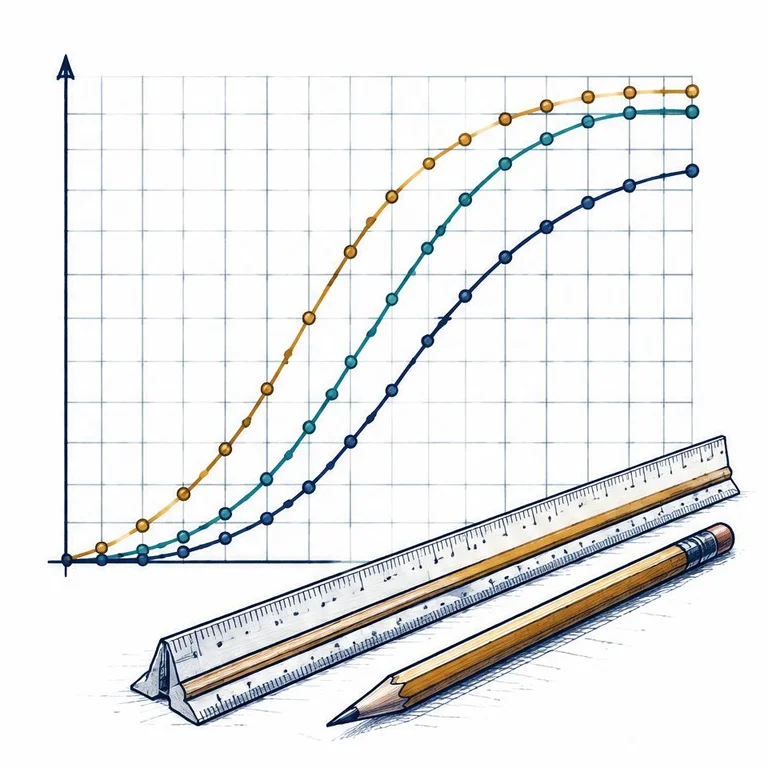 Construction & ProjectReading an S-curve: planned, earned and actual on one chartA practical way to separate planned accomplishment, earned value and actual cost before interpreting the gaps.15 November 2026 · 8 min read
 Construction & ProjectRetention Money: Follow the Cash Through Each PaymentUnderstand retention deductions, caps, releases, and cumulative payment arithmetic with a transparent worked example.17 November 2026 · 7 min read
 Construction & ProjectMeasuring physical progress: weighted milestones versus percent completeUse evidence-based milestones and stable weights to report completed work without confusing expenditure with physical progress.15 November 2026 · 8 min read
Sources and standards
About the author
Dr. Hassan Khames Eliwa holds a PhD in Construction & Built Environment and has more than 20 years of international project controls experience. He is Director of Eliwa Project Controls Limited in Auckland and founder of PMMilestone.org and PMMilestone.com.
Buy me a coffee