Articles & guides
Longer explanations behind the calculators: where the formulas come from, what the results mean and the mistakes worth avoiding.
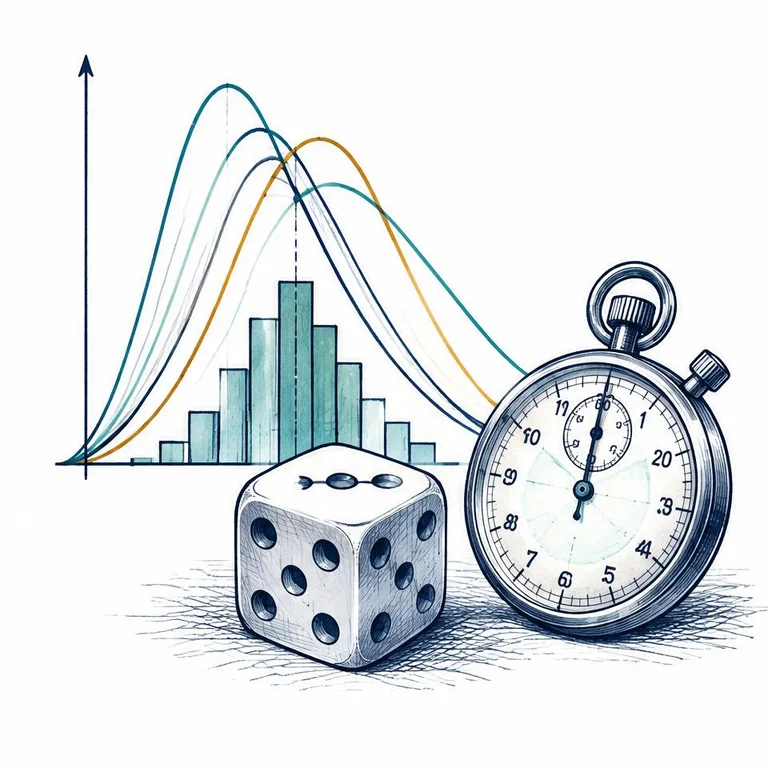 Construction & ProjectMonte Carlo schedule risk in plain English: what P50 and P80 actually meanRead schedule percentiles without confusing a serial simulation, a network forecast and a commitment.15 November 2026 · 8 min read
 Construction & ProjectMeasuring physical progress: weighted milestones versus percent completeUse evidence-based milestones and stable weights to report completed work without confusing expenditure with physical progress.15 November 2026 · 8 min read
 Construction & ProjectLiquidated damages for construction delayUnderstand delay triggers, calendars, caps and assessment records without confusing calculator arithmetic with legal entitlement.15 November 2026 · 8 min read
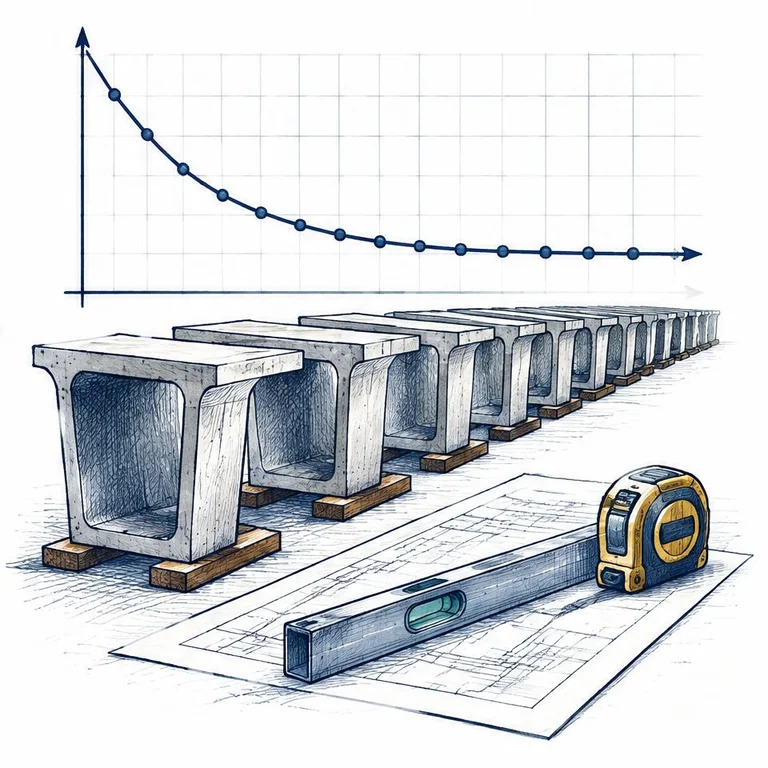 Construction & ProjectLearning curves in construction: averages vs unitsApply Wright cumulative-average learning curves, verify incremental unit effort, and translate repeatable work into duration and labour cost.15 November 2026 · 8 min read
 FinancialComparing interest rates properly: nominal, effective and the Rule of 72Put interest quotes on the same annual basis before comparing them, then use doubling estimates only within their limits.15 November 2026 · 8 min read
 FinancialThe 50/30/20 budget and how big an emergency fund should beUse percentages to start the conversation, then size your cash reserve around the bills that would survive an income shock.15 November 2026 · 8 min read
 Construction & ProjectThree-point estimating: when PERT beats a single guessA practical guide to three-point duration estimates, weighted averages and the limits of turning uncertain activities into a promised date.14 November 2026 · 7 min read
 Fitness & HealthTDEE and macros: build an adjustable nutrition planEstimate daily energy needs, translate calories into protein, fat and carbohydrate, and adjust from real trends rather than false precision.14 November 2026 · 8 min read
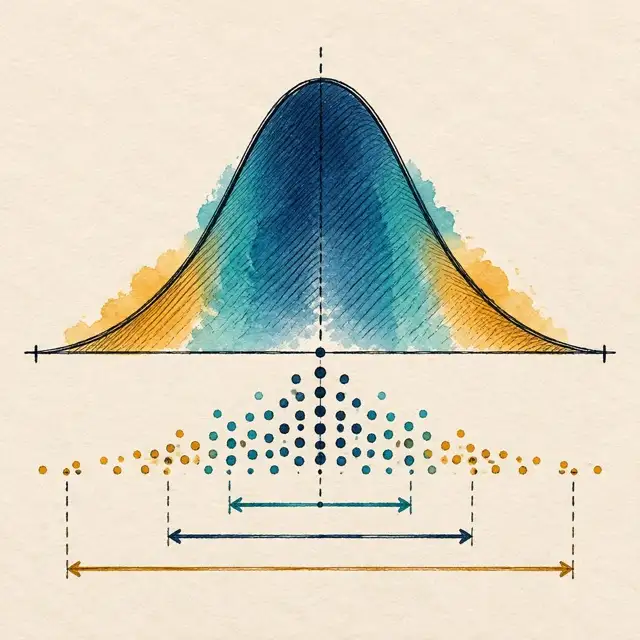 MathStandard deviation without the jargonThe average tells you the centre. Standard deviation helps describe the spread, provided you know what the data represents.14 November 2026 · 7 min read